HOW TO REVIEW YOUR TRADES: A WEEKLY PROCESS.
A trading journal only pays for itself when you read something back out of it.
Most traders log their trades and then review them the way they remember them: the big winner they're proud of, the loss that still annoys them, and a vague promise to be more disciplined next week. That kind of review changes nothing, because it starts from memory rather than from the numbers.
A useful review asks a few fixed questions on a fixed schedule. Which setup made money, and which lost it? How much of each winning move did you keep? Which rules did you break, and what did breaking them cost? And what's the one change worth testing next?
Why most trade reviews don't change anything
Three habits sink most reviews.
Reviewing outcomes instead of decisions. A trade that followed every rule and hit its stop was a good trade. A trade that broke three rules and made money was a bad one that got lucky. So if your review only sorts winners from losers, it teaches you to repeat the lucky ones.
Drawing conclusions from a handful of trades. A setup that lost four trades in a row may be fine, and one that won four may be broken. A sensible rule is to log 20 to 30 trades of a setup before you judge it at all. A weekly review is for spotting questions, not answering them.
Ending with a resolution instead of a rule. You can't test "be more patient". You can test "no pullback entries after the second touch of the 10-day". Vague rules slow you down in the moment, while specific ones make decisions quick.
How the source traders study their own trades
None of the traders this blog draws on rely on memory. Their methods differ, but they share a shape: start from a record, look at a lot of charts, and turn what you see into a specific rule.
A low-friction study loop
Start from your own journal, meaning the list of every ticker you've traded. For a given question, pull up each chart and ask where the best risk-reward entry would have been.
In one documented short-side study, the main idea showed up in about five charts, and it took more than 200 to refine the execution. Reviewing charts rather than running a quantitative backtest keeps it quick, because that data is slow to gather and hard to define. And there's no point archiving charts somewhere you never go back to.
The lesson is about friction: make studying easy enough that you keep doing it. The useful pattern for a review is the two speeds. A small sample is enough to find an idea, but it takes a large one to refine it.
The model book
A model book is an annotated collection of chart examples that works as a playbook. For each example, you record the date, ticker, theme, setup, entry trigger, risk, ADR, add points, trailing average, exit trigger and result. Then you track statistics across them, such as which moving average works best as a sell rule.
Once a month, compare your own trades with the best setups the market actually offered, and annotate the ones you missed. It can start as two- to three-hour blocks several times a week and settle into one or two charts a day in under 30 minutes, which adds up to about 252 a year.
The deep dive
A deep dive narrows a question (for example, liquid stocks that rose 50% or more in 14 days), builds a scan for it, saves every hit to a database, and studies what the best ones had in common before, during and after the move.
Cover at least five years, so that different market conditions are included, and build your own database rather than borrowing someone else's. Pradeep Bonde (Stockbee) is known for compressing this kind of study into a few intensive days.
Qullamaggie: study the big winners
Kristjan Kullamägi (Qullamaggie) built his edge by going through about 5,500 US stocks on monthly charts, at roughly 30 seconds a chart. He pulled out every huge mover and reviewed its price action, news and earnings.
His recurring advice is not to take his word for anything, and to verify it on the charts yourself. And his summary of what to do with the result is simple: do more of what works and less of what doesn't.
A review that is non-negotiable
Treat a periodic review as non-negotiable. Track win rate, average R, profit factor, drawdown and P&L histograms, and look for one-to-three-day bursts of hyperactive new positions to see how they turned out. If they went badly, cap new positions per day or week. But keep in mind that simply trading less pauses a drawdown without fixing what caused it.
Two more habits from the same sources belong in any review. Break your results down by month, and re-run your own history with capped losses, because it can change how you size. And Mark Minervini, in notes on his 2021 interview, suggests letting your journal's average win and loss decide between a trailing stop and selling into strength.
The weekly review: 30 minutes
The weekly review is maintenance. Its job is to keep the data clean and to notice what deserves a closer look at the end of the month. Do it on the same day each week.
- Finish the tags. Every trade gets a setup tag from a short, fixed list, and a mistake tag if a rule was broken. A blank mistake field should mean "executed as planned", which makes it information too. The journal template covers which fields are worth keeping.
- Count the trades, by day. Was there a burst of new positions? Note it, along with what you were feeling, before you know how those trades turned out.
- Group the week by setup, in R. This isn't to judge the setups (a week is too small). It's to see where the week's result actually came from.
- Read the biggest winner and the biggest loser on the chart. Was each one the setup you meant to trade? Did the entry, stop and size match the plan?
- Check rule adherence. For each trade: was the stop placed at entry and honoured, was the size inside your risk limit, and was the entry a real trigger rather than anticipation? It's yes or no, nothing in between.
- Write one sentence. One thing to do more of or less of next week. If nothing stands out, write that.
The monthly review: one to two hours
The monthly review is where the decisions get made, on enough trades for the numbers to mean something. Use at least the last 50 trades, or every trade since you last changed a rule.
- Expectancy and profit factor by setup. One setup is usually carrying the account, and another is often losing money while feeling like your best work. Expectancy in R is the fairest comparison, because it ignores how big you happened to trade each one.
- The cost of each mistake. Add up the R on every trade carrying each mistake tag. You can act on a line like "moved my stop: four trades, −5R". You can't act on "be more disciplined".
- MFE and MAE against your exits. How much of each winning move did you bank? How many losers were well in profit first? Do your winners' worst dips sit well above your stop, or near it? MFE and MAE, explained shows how to read them.
- The biggest winners and losers. What did the best five have in common: setup, prior move, market, timing? Did any loss go beyond −1R, and if so why? A gap, a late stop, a stop moved down?
- Test one change on past trades. Take the idea the review produced and re-run it on the trades you already took, changing one thing only. Then check it on a larger sample before you adopt it. Backtesting a rule on your own trades covers the method and its traps.
- Update the model book. Save your best trades of the month as examples of their setup, along with the best setups you missed. Over a year, the book becomes a record of what your setups look like when they work.
Doing each step in TradePiko
You can do every step above in a spreadsheet, but the friction is why most people stop. Here's where each one lives in TradePiko, which imports trades from 40 brokerages, so the first layer of the journal fills itself in.
| Review step | Where it lives |
|---|---|
| Tag every trade | Setup tags, applied automatically by fixed rules and never overwriting a manual tag, plus mistake tags you add |
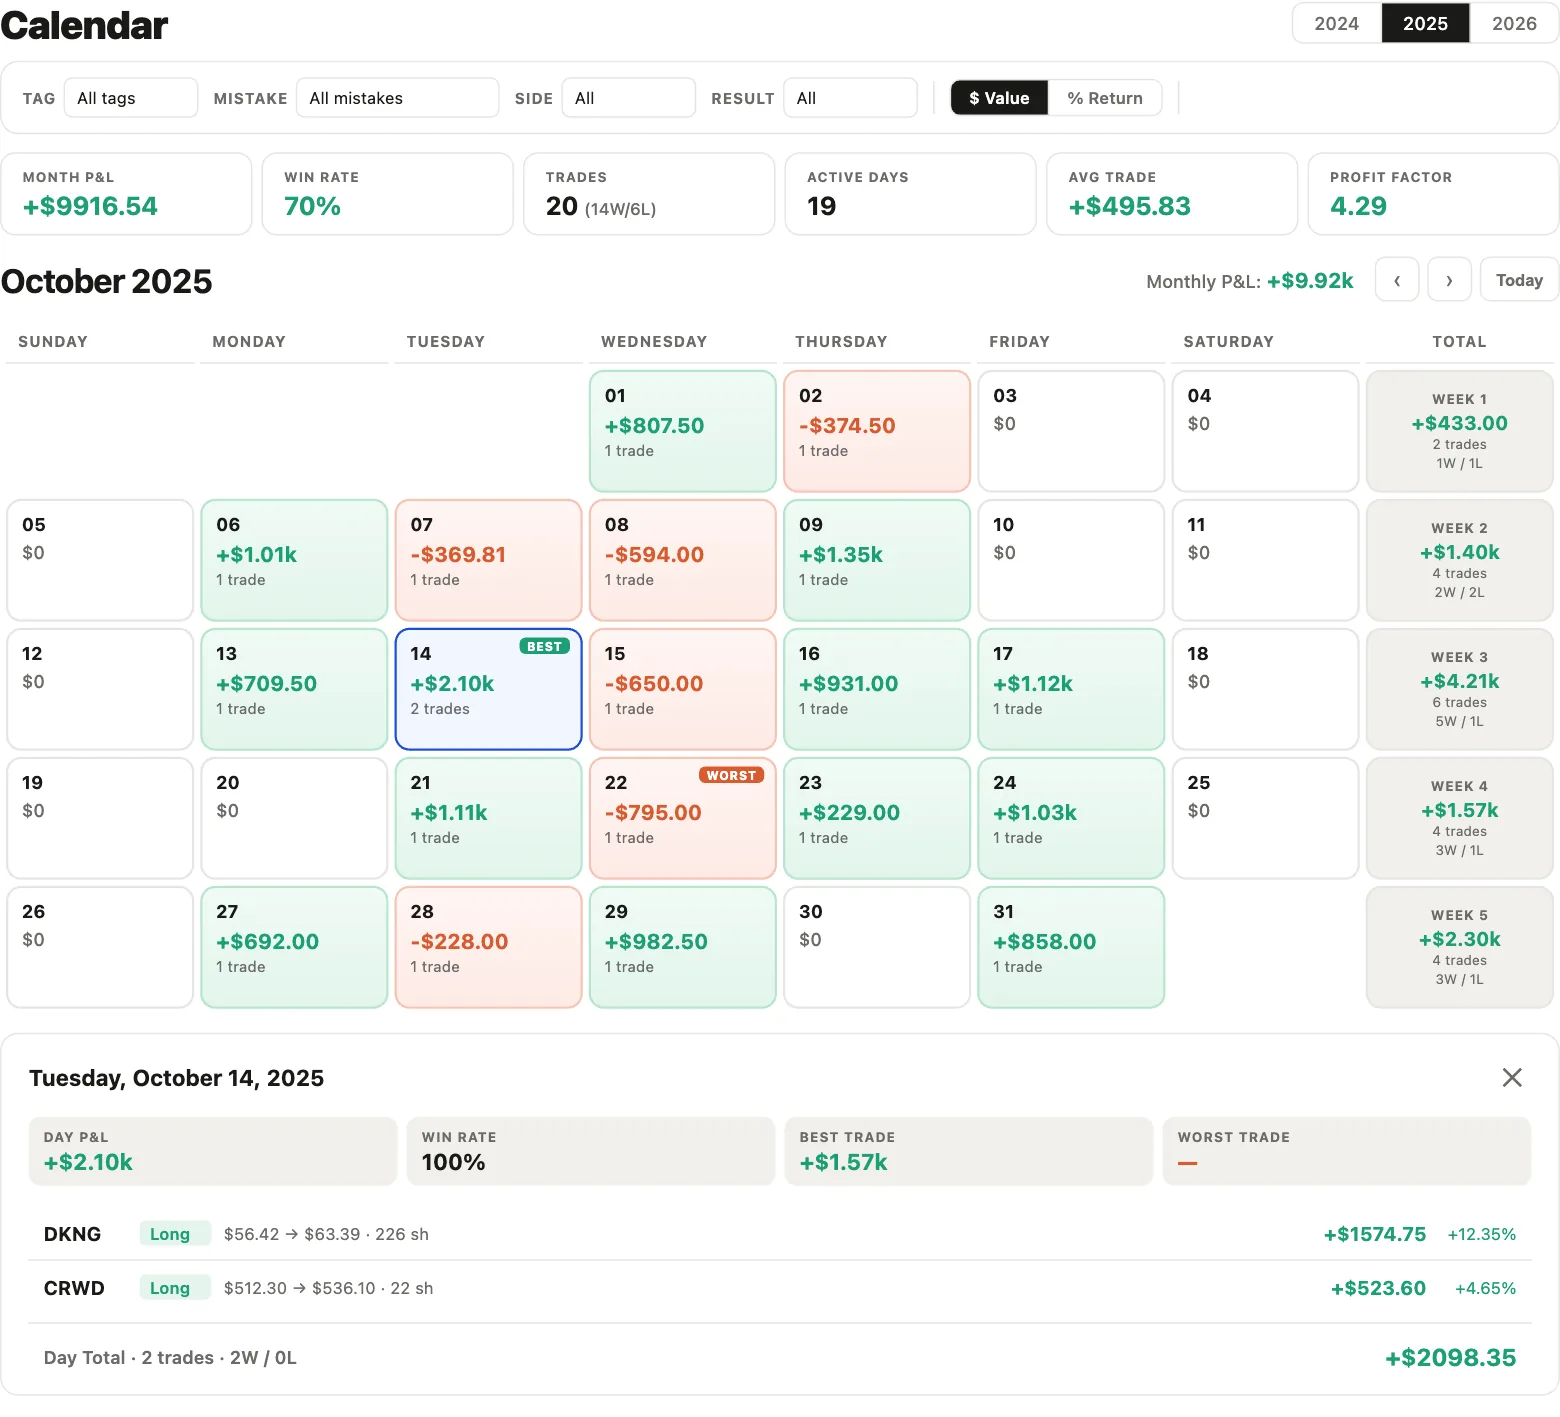
| Weekly count and P&L | P&L Calendar: daily results, weekly totals with win/loss counts, filterable by tag, mistake, side and result |
| Daily notes and rule adherence | Daily Report Card: a grade, one process goal, a reminders checklist, lessons and adjustments |
| Results by setup | Filter by any tag to see win rate, expectancy and profit factor for that setup alone |
| MFE and MAE against exits | MFE and MAE calculated on every trade, and every trade drawn on its daily chart with entry and exit plotted |
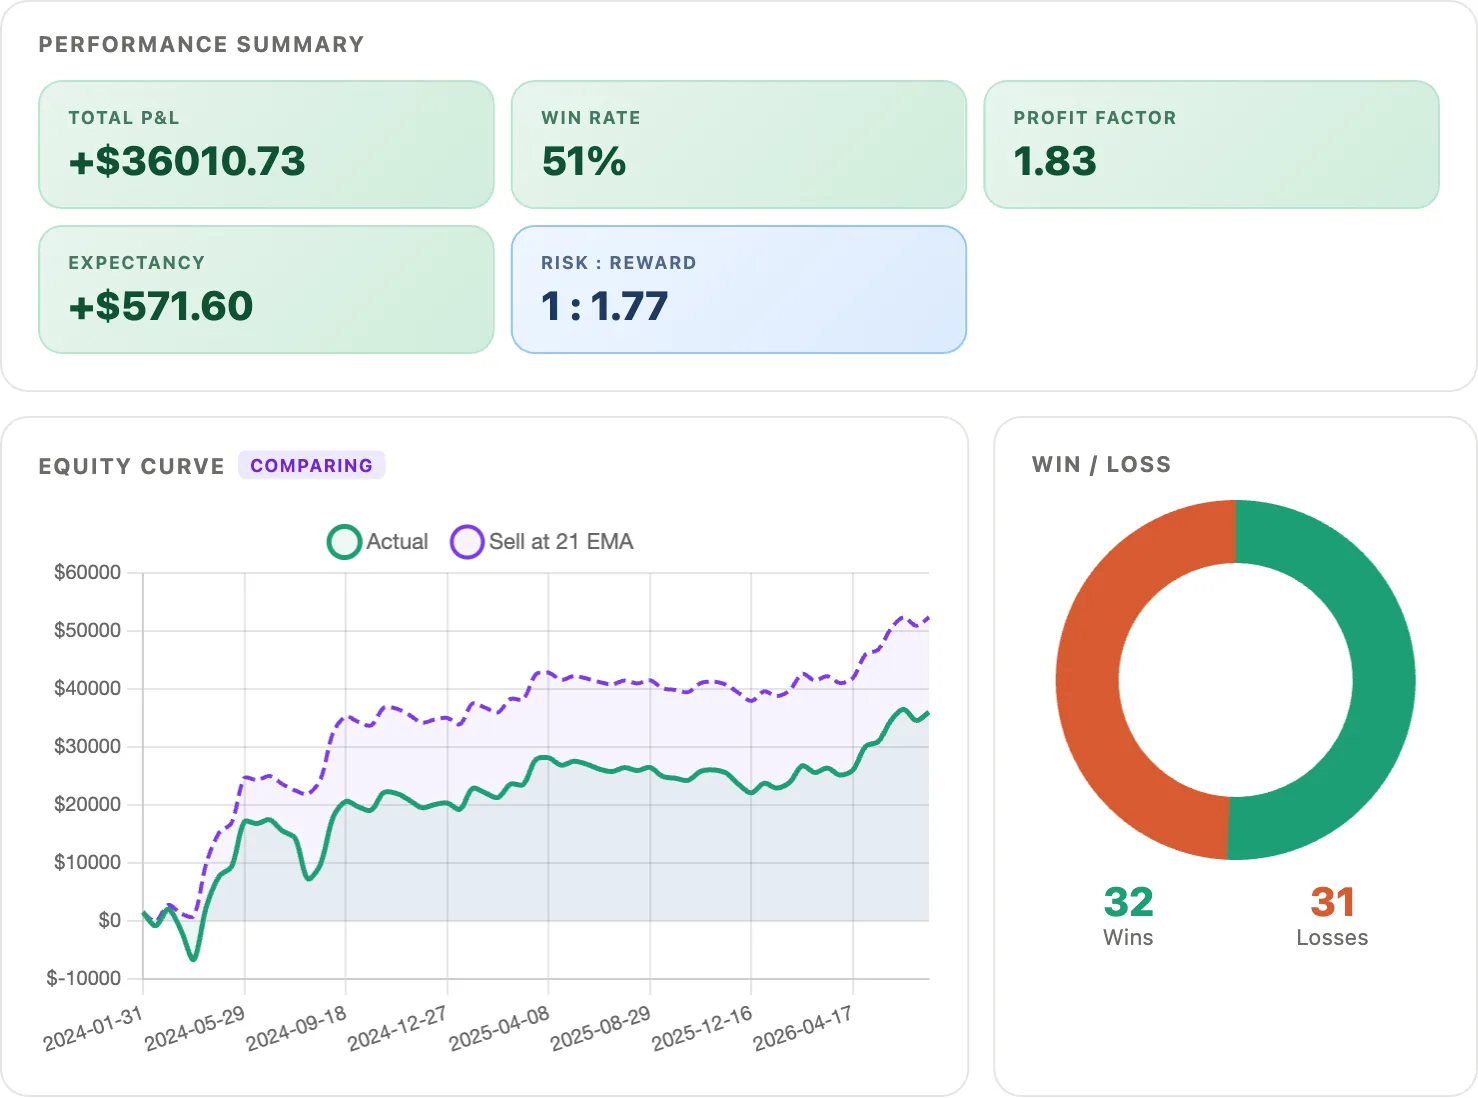
| Test one change | Trade Simulation: presets such as By Tag, By Mistake, Remove Worst, Winners Only, Cut Losers Faster and Day of Week, plus manual P&L, size and partial overrides, all compared against what you actually did |
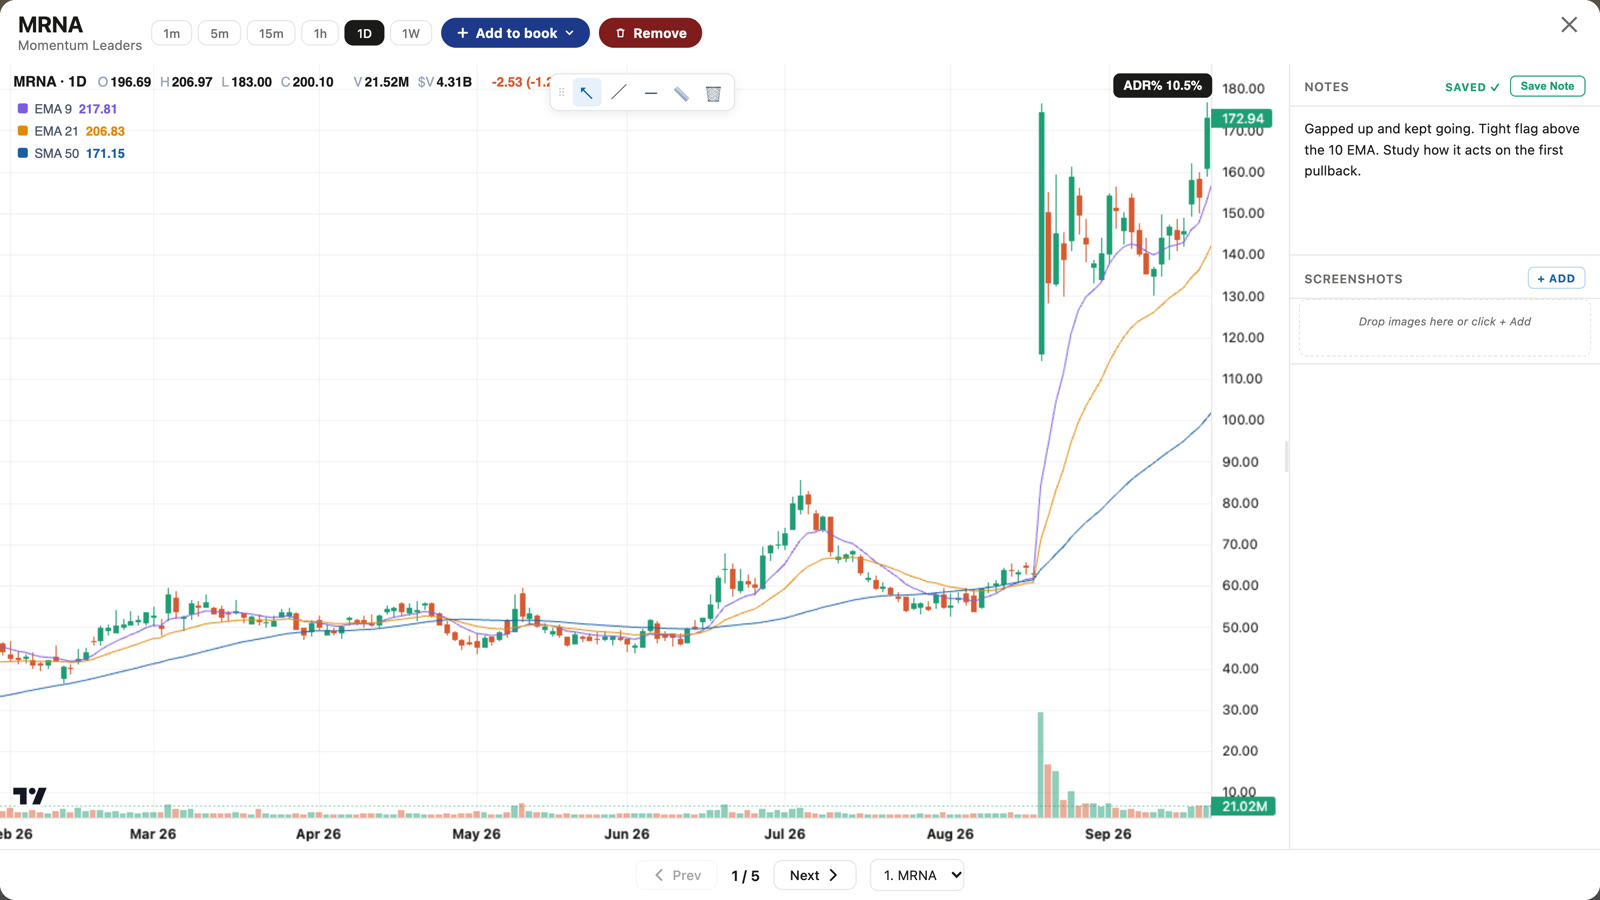
| Model book | Model Books: save chart examples into named books, with notes |
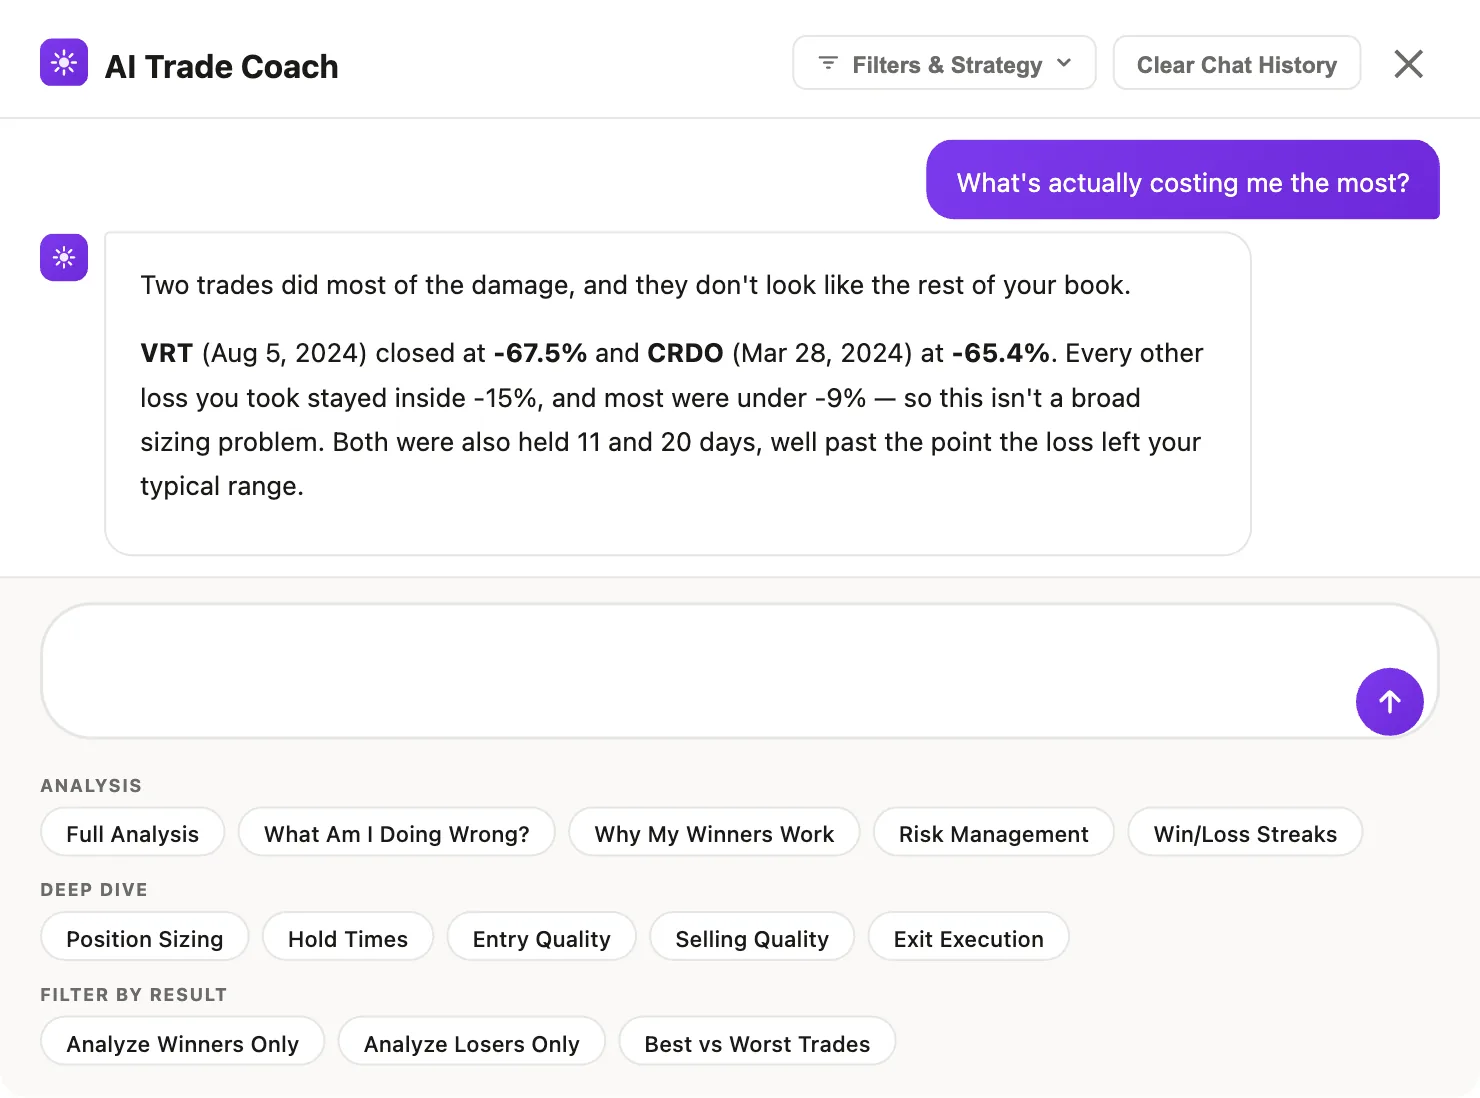
| Questions you didn't think to ask | AI Trade Coach: ask questions of your own trade history |
Trade Simulation changes the trades you choose; it does not re-run your history with a new exit rule automatically.
The weekly review mostly happens in two places. The P&L Calendar shows each day and week at a glance, and its tag and mistake filters turn "how did my pullbacks do this month?" into one click.
The Daily Report Card is where you write down the process side while it's fresh. You get a grade for how well you followed your plan (not for the P&L), one behavioural goal, a checklist of your own reminders, and what you'd change next time. Those notes are what the weekly rule-adherence check reads back.

For the monthly review, Model Books hold the annotated examples. And the AI Trade Coach answers questions about your own history, such as what's costing you the most or how your best and worst trades differ, which is a quick way to find the idea worth testing.
Run your first monthly review this week
Connect your broker and your history is imported, charted and measured. Then the review is reading, not typing:
- Results by setup and by mistake. Setup tags are applied for you and mistake tags take a click, so expectancy per setup and the cost of each mistake are always one filter away.
- MFE and MAE on every trade. See how much of each move you kept and whether your winners ever come near your stop.
- Trade Simulation. Exclude a setup with By Tag, remove a mistake with By Mistake, or cap losses with Cut Losers Faster, and compare the result against what you actually did.
- Daily Report Card, P&L Calendar and Model Books. The weekly and monthly routine in one place.
Sources and credits. Qullamaggie's monthly-chart history study and his "verify it yourself" and "do more of what works" advice are from his streams and interviews. Mark Minervini's point on average win and loss is from his 2021 interview. Some ideas are adapted from public trader interviews and notes. Educational content only.