Tradepiko — The Trading Journal That Trades Back

TRADE WITH
EDGE,
NOT HOPE.

The trading journal that fights back. Track every trade, simulate alternate outcomes, and let AI surface the patterns buried in your data.
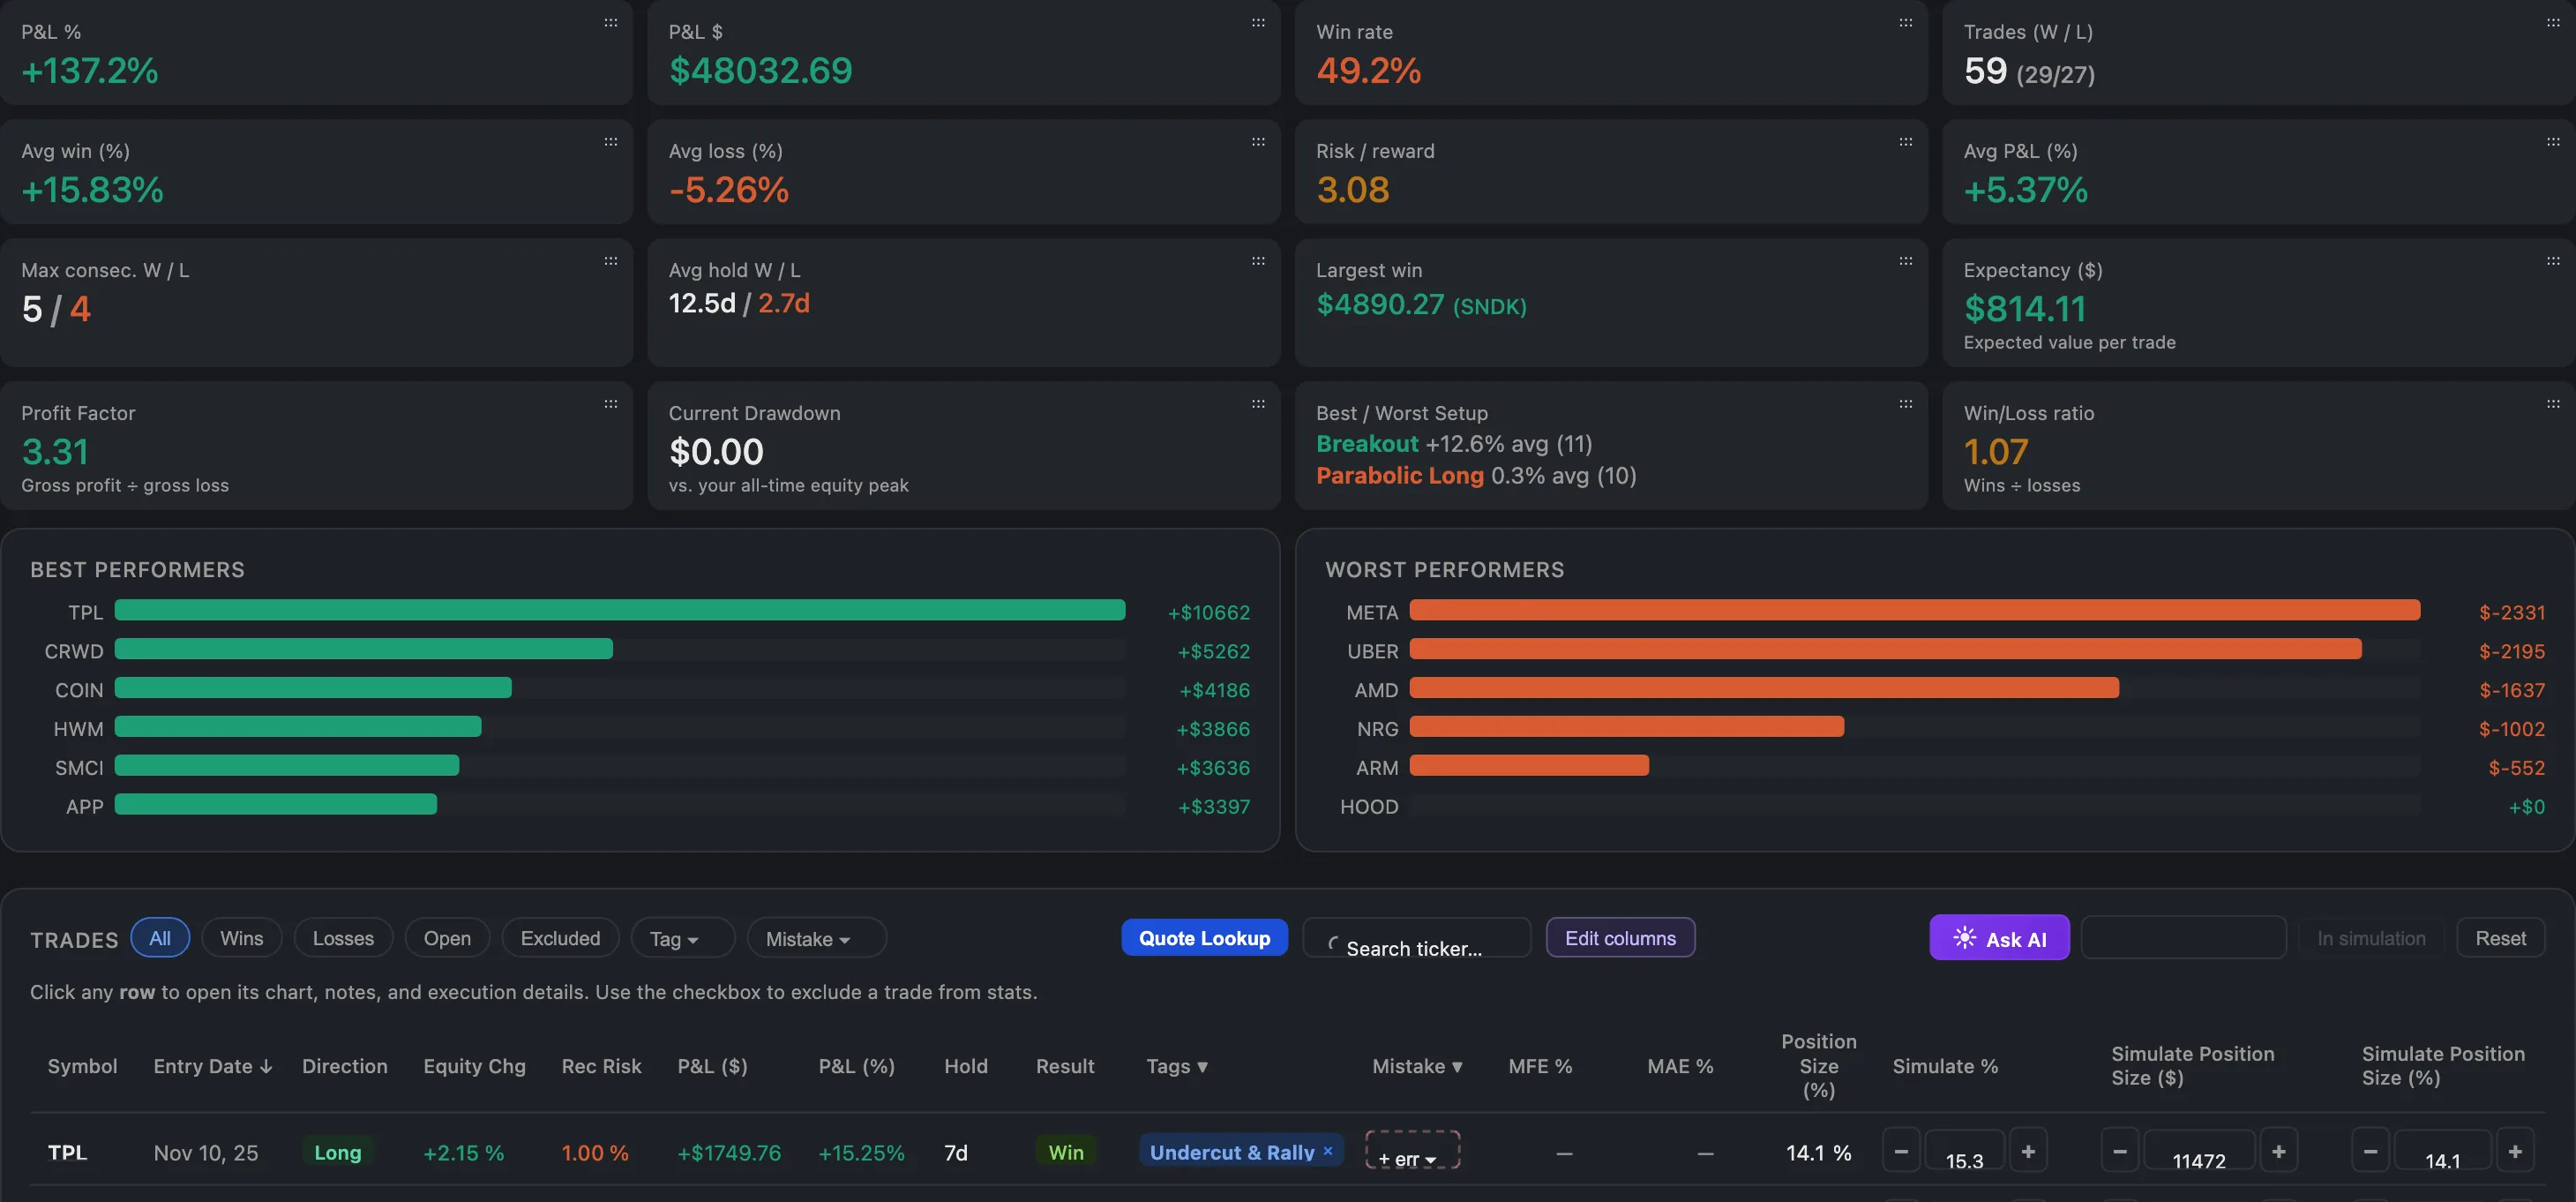
Live Dashboard
TradePiko Dashboard
Net P&L
+$4,820
Win Rate
67.4%
Profit Factor
2.31
Avg R:R
2.3:1
AI
Your win rate drops 18% on Fridays. Consider reducing Friday exposure or tightening stops.
Simulation
+78%
+52%
MFE / MAE
MFE
3.2%
MAE
1.1%
Momentum Watchlist · Soon
Position Sizing Advisor
Trade Journal
AI Trade Coach
Simulations
Model Books
Calendar Journal
MFE / MAE Analysis
Mistake Tracker
CSV Import
TradingView Charts
Multi-Account
Broker Auto-Sync
Momentum Watchlist · Soon
Position Sizing Advisor
Trade Journal
AI Trade Coach
Simulations
Model Books
Calendar Journal
MFE / MAE Analysis
Mistake Tracker
CSV Import
TradingView Charts
Multi-Account
14 tools, one dashboard
EVERYTHING A
SWING TRADER NEEDS.

Every feature is designed around one goal: understanding what's working in your trading and fixing what isn't.

📊
Trade Journal + CSV Import
Import from Webull via CSV. Trades land in a structured journal with P&L, R-multiples, hold times, and full tagging.
📅
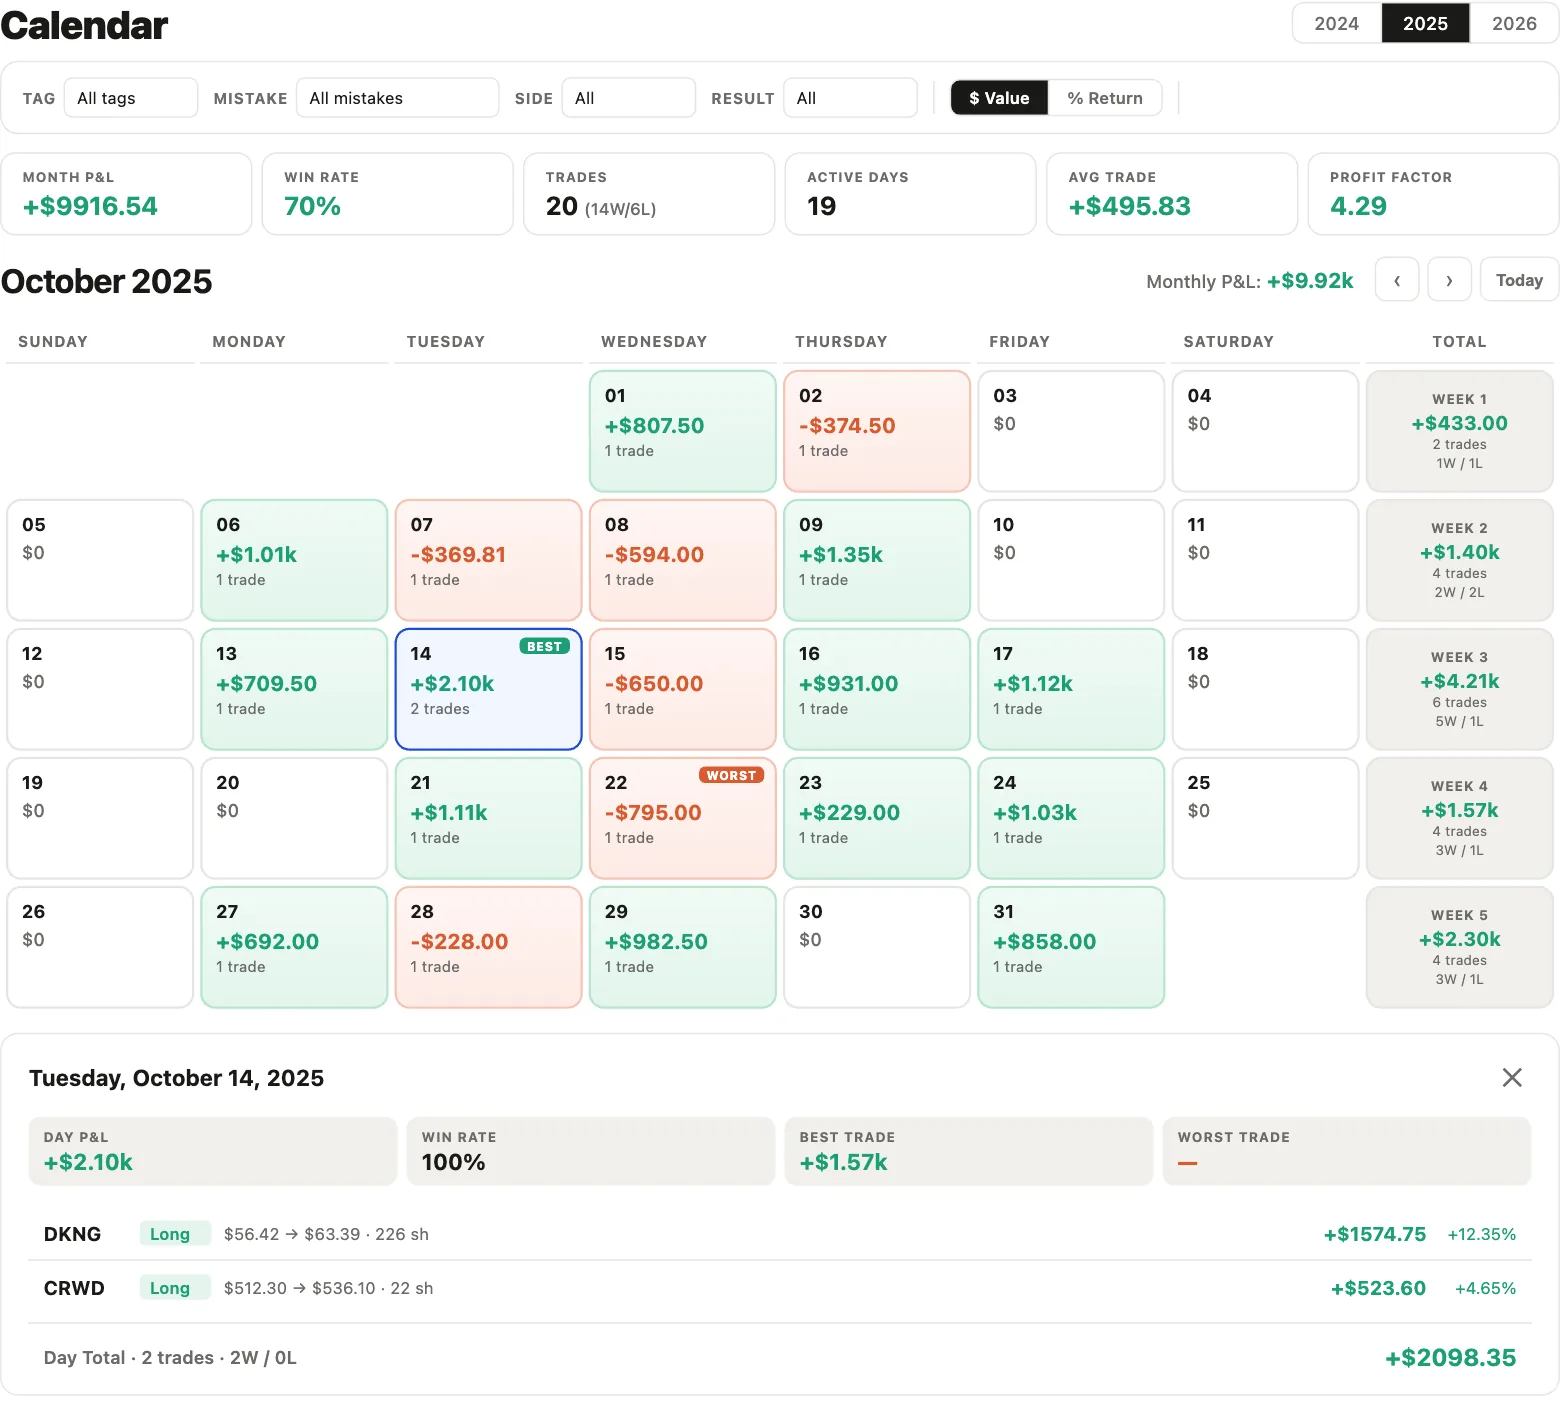
Calendar Journal
See your trades on a visual calendar. Add daily notes, spot P&L patterns by day-of-week, and review performance month by month.
🎯
MFE / MAE Analysis
Track how far each trade went in your favor and against you. Identify if you're leaving money on the table or holding losers too long.
🤖
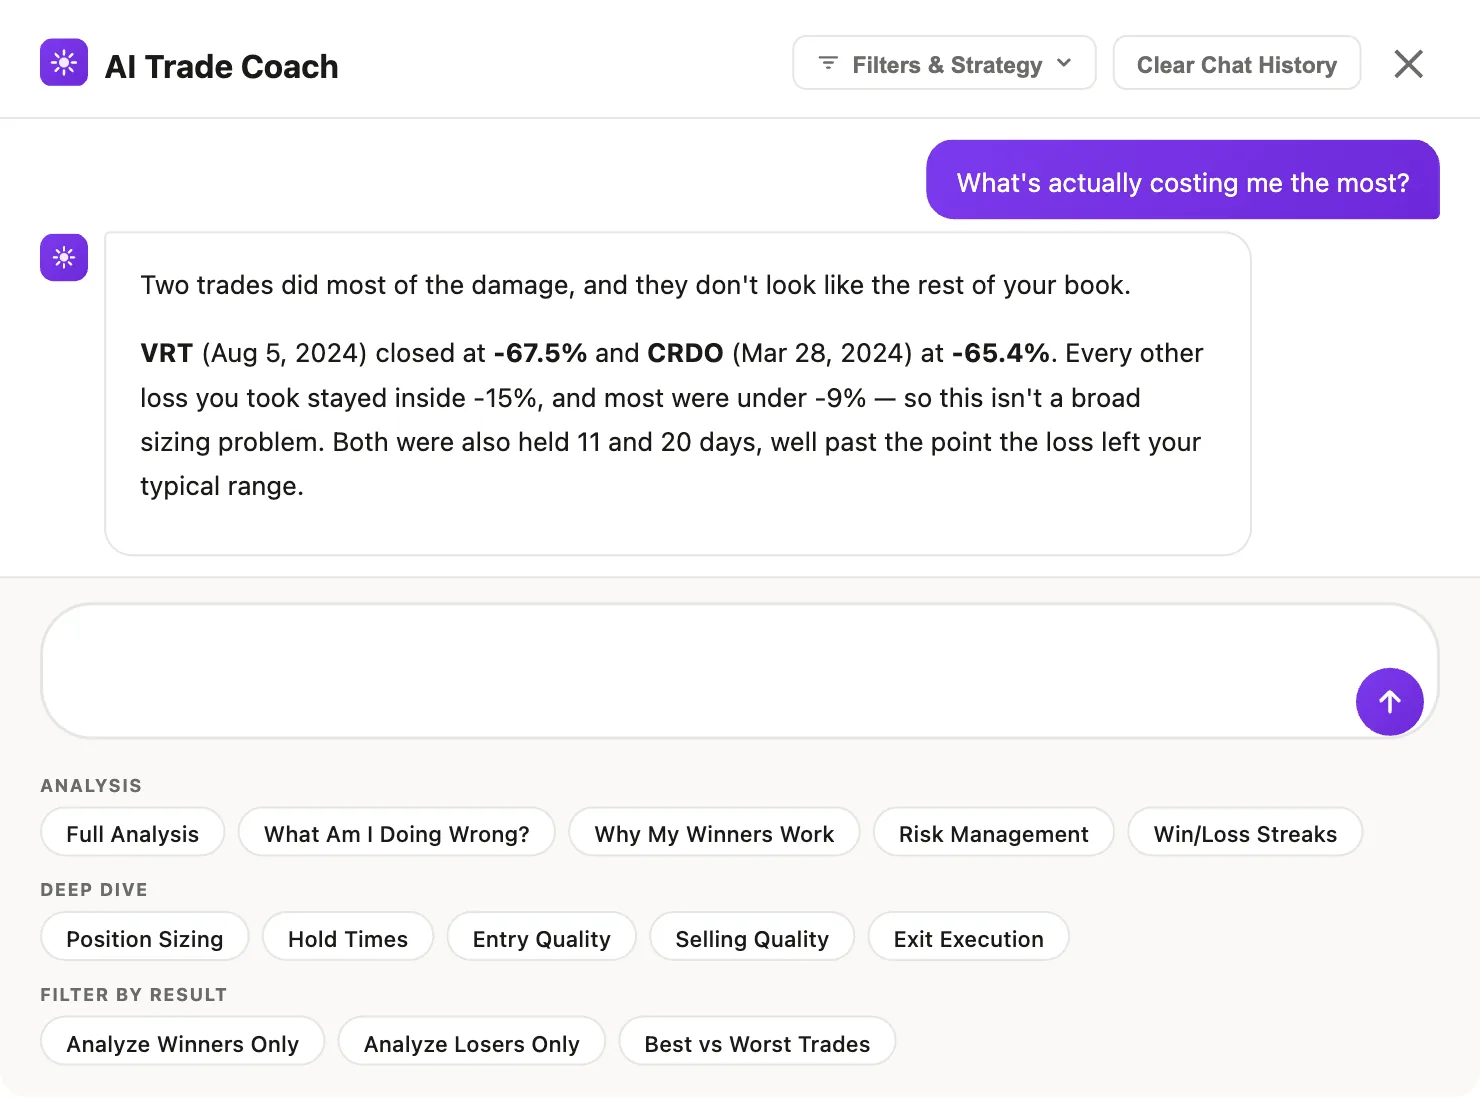
AI Trade Coach
12+ analysis modes powered by Claude AI. Ask about your winners, losers, risk management, entry quality — answered from your real data.
Trade Simulation
Replay trades with different stops and position sizes. Compare equity curves across scenarios. Save unlimited simulations.
Mistake Tracker
Tag every trading error with a named mistake. Track which ones cost you the most and watch them decrease over time.
🏷️
Tags + Rec Risk
Organize trades by setup type (VCP, EP, breakout). The rec risk engine suggests position sizes based on your tag-level win rates.
📸
Trade Screenshots
Attach chart screenshots to any trade. Build a visual library of your setups for review and pattern recognition.
📈
TradingView Charts
Click any ticker to open a full TradingView chart. Switch timeframes instantly. Available across every page of the dashboard.
🔀
Multi-Account
Switch between trading accounts instantly. Each account has its own trade data, stats, and journal — all in one dashboard.
⬇️
CSV Manager
Upload, manage, and delete individual CSV files. Drag-and-drop support. Your data stays organized as your trade history grows.
⚙️
Draggable Everything
Reorder stat boxes, sidebar nav, model book cards, and tickers. Your dashboard, your layout — arrange it how you think.
Simulation engine
WHAT IF YOU
TRADED IT
DIFFERENTLY?

Most traders never know how close they were to a better outcome. Replay your actual trades under different rules and see exactly what changes.

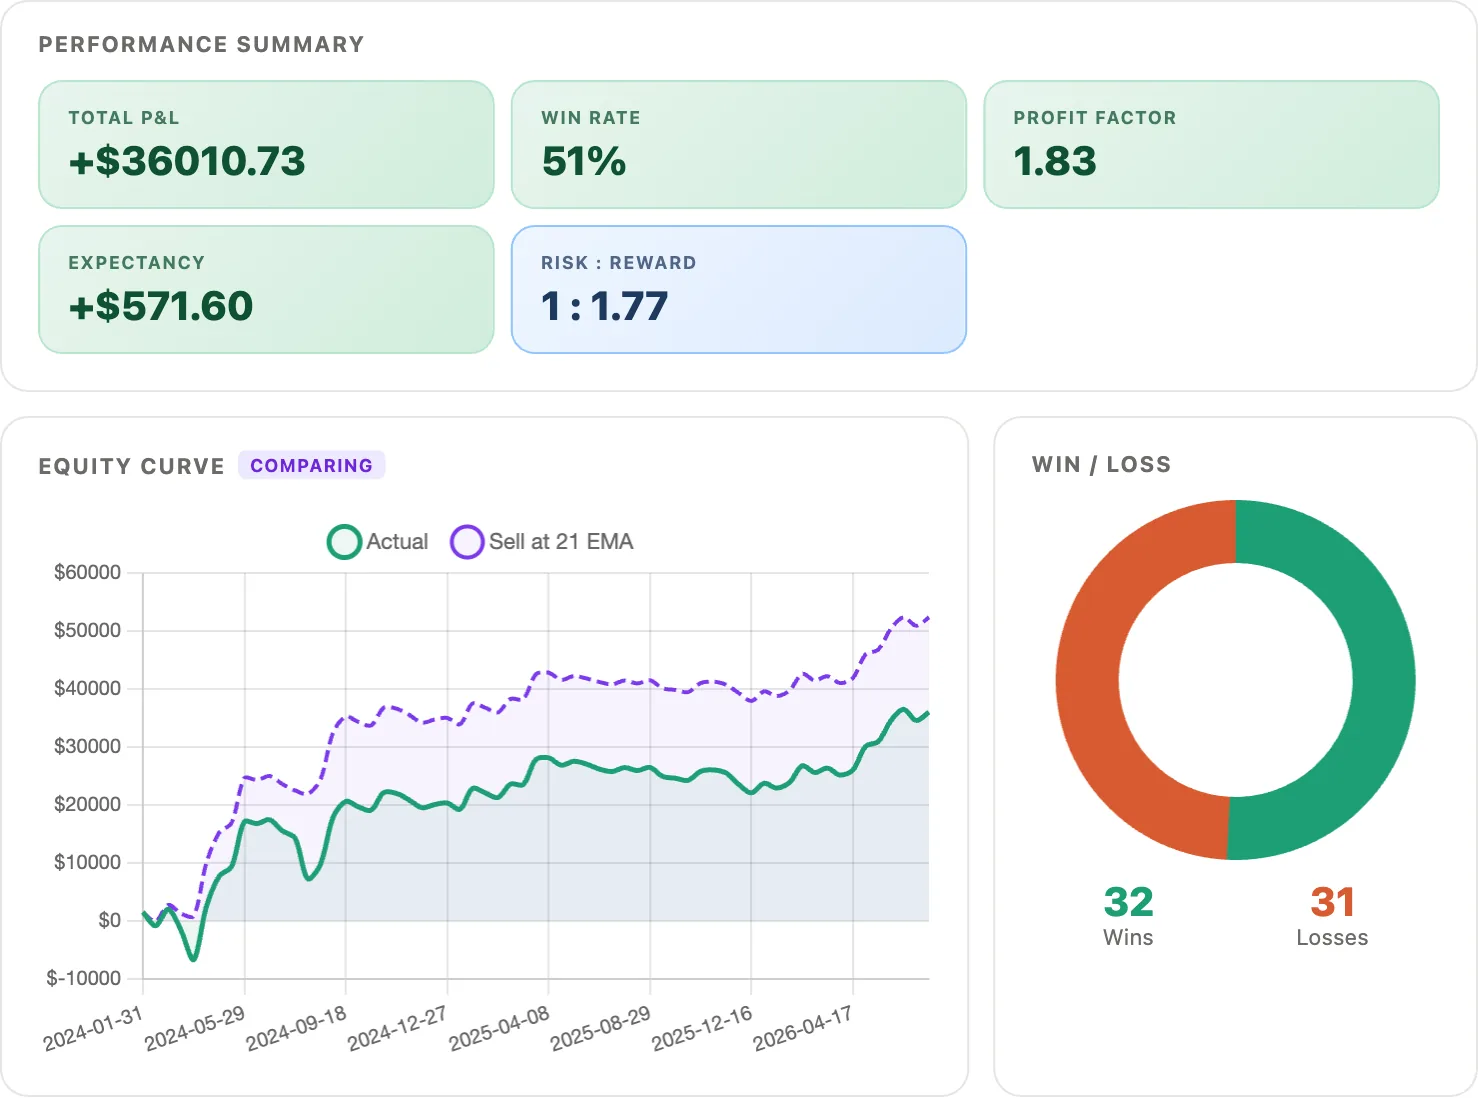
Equity curve replay — visualize how your account grows under different risk rules
Stop adjustment — test tighter or wider stops across your full history
Position sizing scenarios — scale up winners, cut losers earlier
Save & compare — save unlimited simulations, navigate with arrow keys
Exclude trades — remove specific trades and see the impact instantly
Simulation — Equity Scenarios
Optimized
+88%
Actual
+52%
Wider stop
+64%
Tight stop
+31%
Optimized scenario vs actual
+$2,840
With tighter stops and proper position sizing on your last 50 trades
AI-powered analysis
YOUR DATA HAS
ANSWERS.
ASK IT ANYTHING.

12 built-in analysis modes plus custom questions — all answered from your actual trade history by Claude AI.

Pattern detected
Your momentum breakout trades have a 74% win rate before 10:30am, dropping to 41% after 11am. Consider a hard cutoff.
Based on 68 trades · Confidence high
Risk alert
You've averaged 2.1x your planned stop on losing trades this month — costing you approximately $340/month in preventable losses.
Last 30 days · Impact $340
Opportunity
Trades tagged "earnings play" have your highest R:R at 3.8:1 but only 8% of volume. You're underweighting your best setup.
Based on 12 trades · Avg R:R 3.8:1
Built-in analysis modes
Full Analysis
What Am I Doing Wrong?
Why My Winners Work
Risk Management
Win/Loss Streaks
Position Sizing
Hold Times
Entry Quality
Exit Execution
Winners Only
Losers Only
Best vs Worst
Pattern recognition
Scans your trade history for time-of-day patterns, setup correlations, and performance by market conditions.
Behavioral analysis
Detects costly habits — stop-moving, revenge trading, overtrading — before they compound into drawdowns.
Custom questions
Type any question about your trading. "What's my worst setup?" or "Should I trade more on Tuesdays?" — answered with your numbers.
Date-range filtering
Analyze any time window — current month, last 3 months, last year, or a custom range. See how your edge evolves.
Model Books
STUDY THE BIGGEST
WINNERS. BUILD YOUR
PLAYBOOK.

The best traders don't just track the present — they obsessively study what worked in the past. Model Books lets you build custom watchlists from history's biggest winners and use them as a lens for what to look for today.

10 preset books included — curated lists of the biggest momentum winners from past market cycles, ready to study on day one
Build your own books — create unlimited custom watchlists for any theme, setup type, or study you want to track
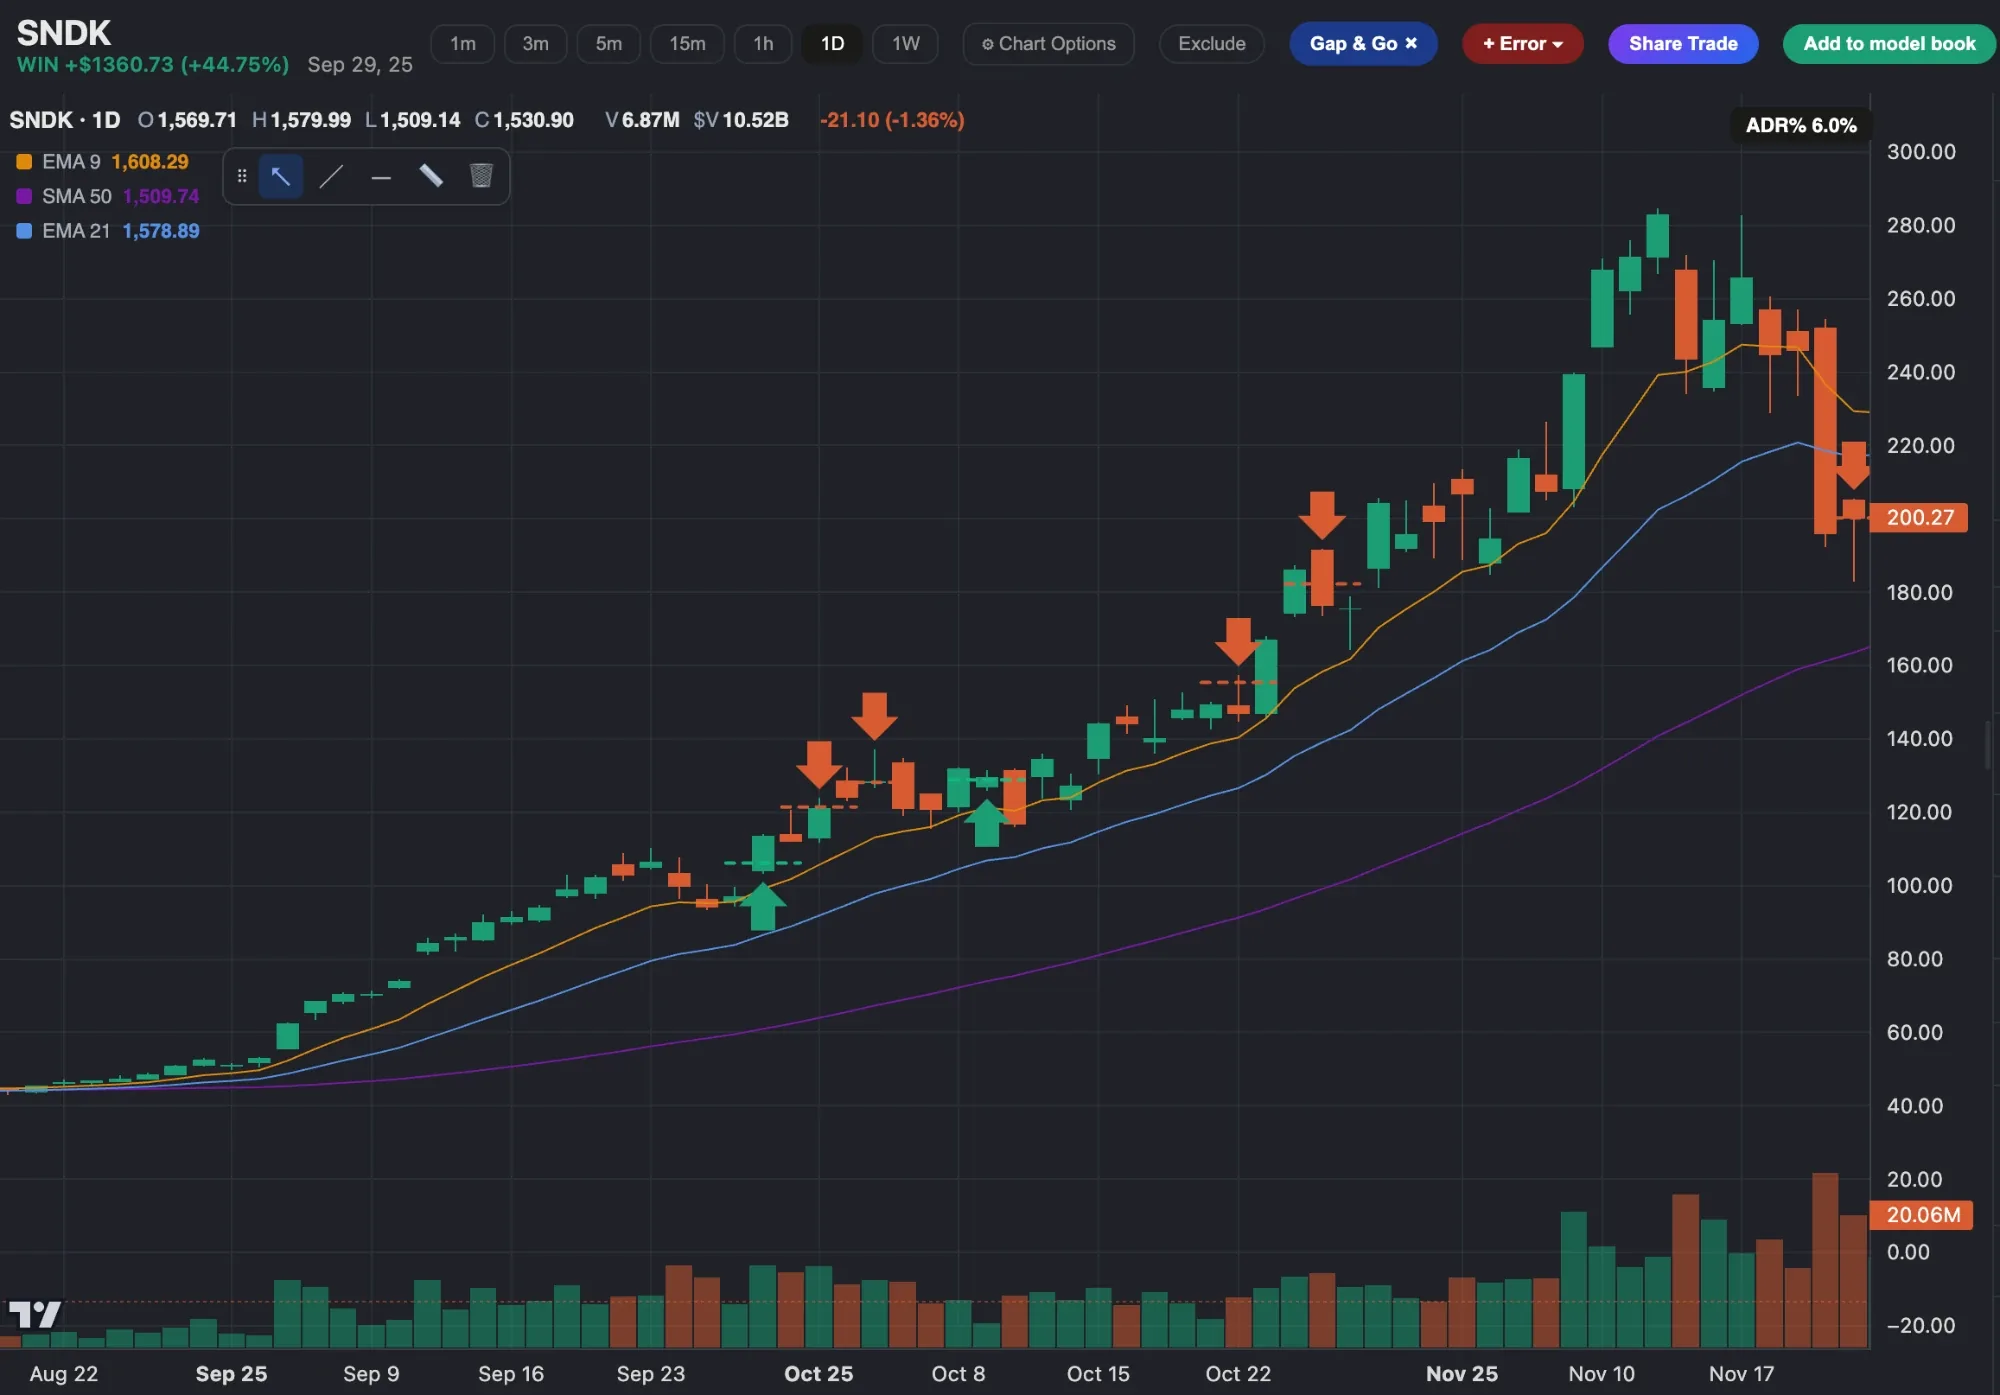
Chart slideshow viewer — flip through every ticker in a book with keyboard shortcuts, study setups at full TradingView scale
Per-ticker notes & screenshots — annotate what you see, attach chart images, build a searchable pattern library
Combine & merge books — select any two or more books and merge them into one master list, with automatic deduplication
Add from PIKO 50 — directly add momentum leaders from the PIKO 50 watchlist into any book with one click
Your Model Books library
2023 AI Leaders PRESET
NVDA, META, MSFT, PLTR…
42 tickers
2021 Momo Runners PRESET
TSLA, GME, ROKU, SHOP…
38 tickers
Defense Cycle 2025 PRESET
LMT, RTX, AXON, LDOS…
24 tickers
+ Create custom book
Combine books
2023 AI Leaders
42
My Current Watchlist
18
Master List · 57 unique tickers (3 duplicates removed)
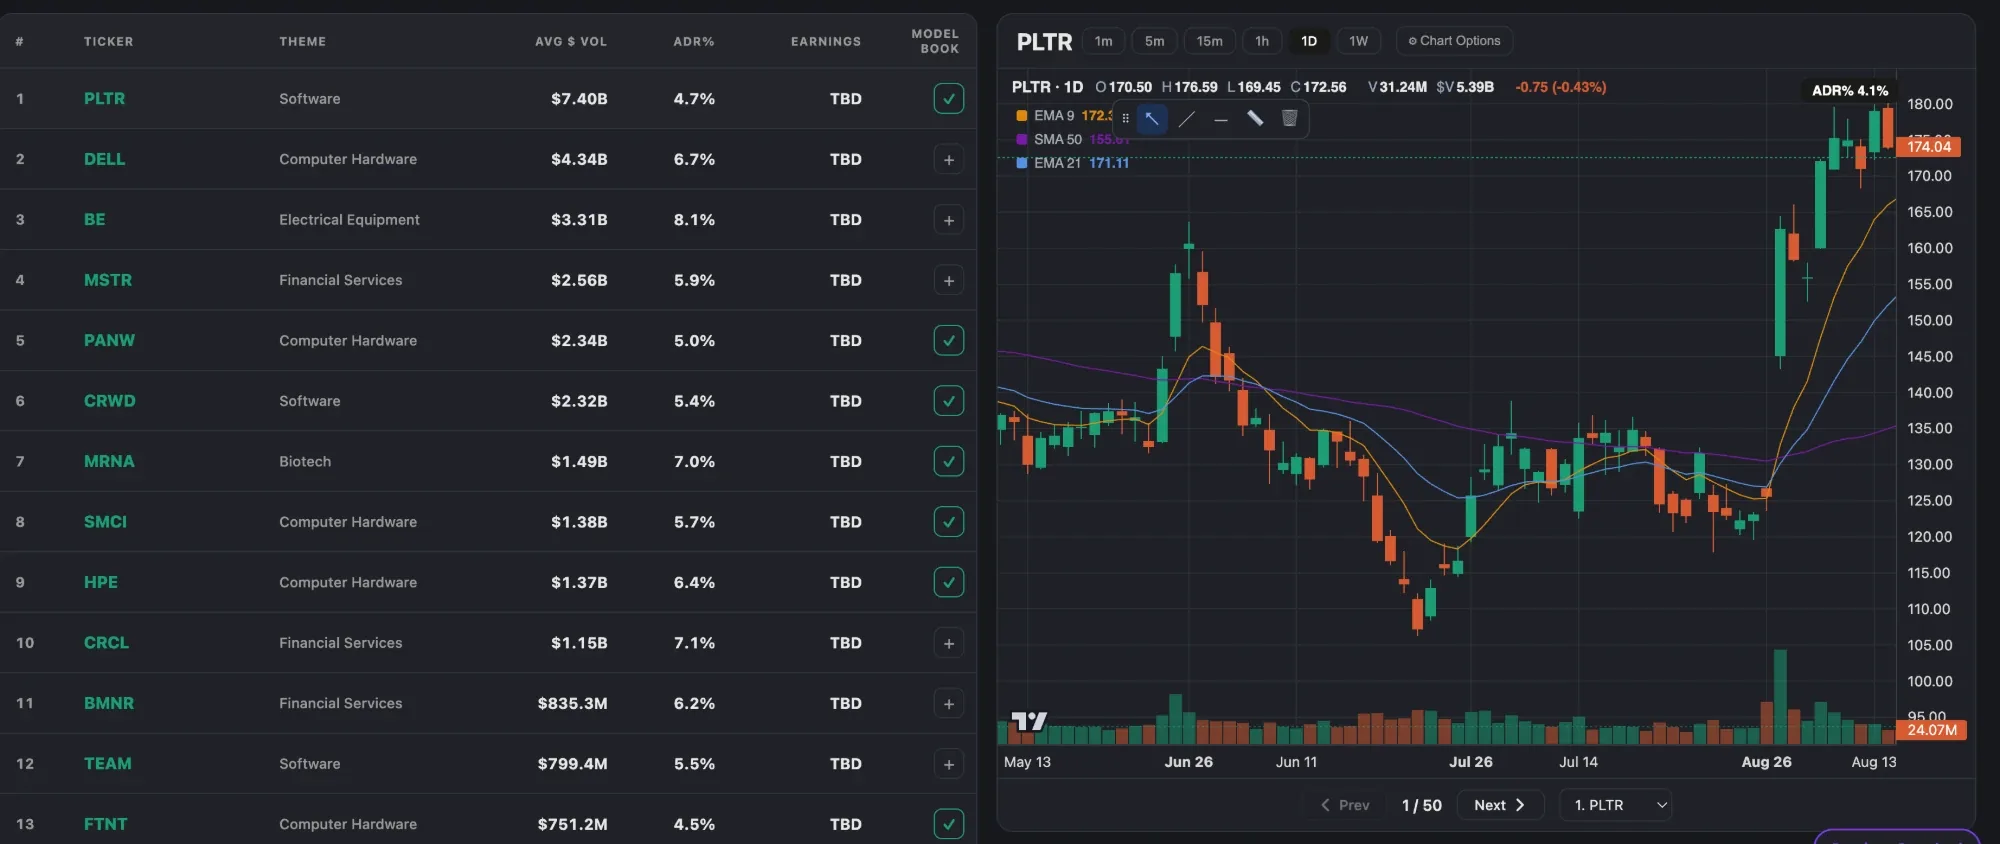
PIKO 50
FIND THE
LEADERS
BEFORE THEY RUN.
🚧
Coming Soon — Piko 50 Momentum Watchlist is in development and will be available to Pro subscribers at launch.

A curated list of the market's top 50 momentum stocks — ranked by relative strength, sector theme, and institutional demand. Stop digging through scanners. The leaders are already sorted for you.

RS rating (1–99) — instantly see which names have the strongest relative strength vs the market
Sector theme tags — AI, Defense, Biotech, and more, so you see what's driving each name
Click-to-chart — open any ticker in a full TradingView chart without leaving the page
Institutional demand indicators — see which names smart money is rotating into
One-click to Model Books — add any leader straight into your watchlists for deeper study
Piko 50
Updated daily
All
AI
Defense
Biotech
Semis
#
Sym
Theme
RS
Inst. demand
1
NVDA
AI / Semis
98
96%
2
PLTR
AI / Defense
96
91%
3
APP
AdTech
94
87%
4
AXON
Defense
92
83%
5
RDDT
Internet
90
79%
Position Sizing Advisor
YOUR SIZE,
AUTO-TUNED
TO YOUR EDGE.

Stop guessing how big to size your next trade. The Position Sizing Advisor calculates your risk per trade in real time, so even your worst expected losing streak can't blow past a 5% monthly drawdown — then scales you up automatically when your edge is working.
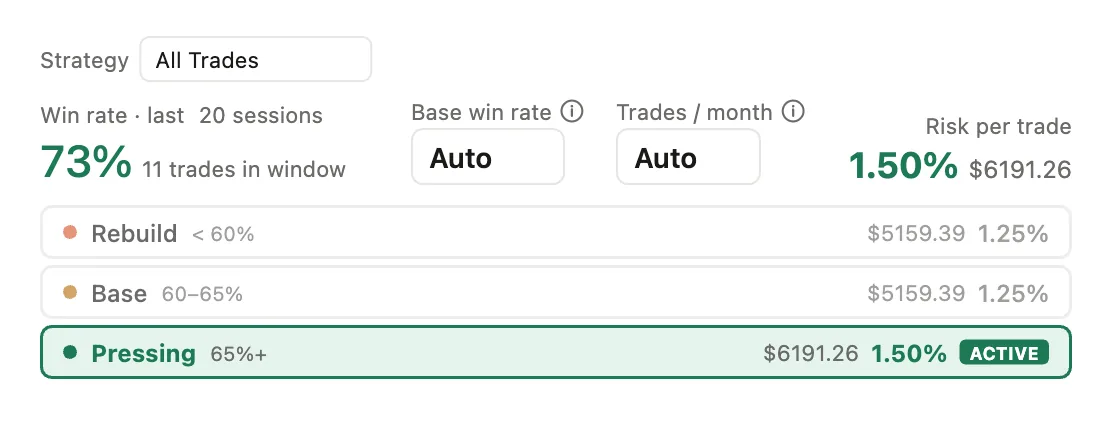
5 dynamic tiers — Survival, Rebuild, Base, Pressing, and Confident, based on your rolling win rate
5% monthly drawdown cap — risk per trade is sized so your worst-case losing streak never exceeds it
Live recommendation — see your exact risk %, risk $, and tier update as your win rate evolves
Rec Risk on every trade — your journal shows what the advisor would have recommended, trade by trade
"What if" simulation — instantly see what your equity curve looks like if every loser had been sized at Rec Risk
Position Sizing Advisor
Live recommendation
Win rate · last 15
38%
19 trades in window
Risk per trade
1.32%
$660 of $50,000
Expected DD
~4.8%
12 losers / mo est.
Tier ladder
Survival
Win rate < 16%
0.40%
Rebuild
16–22%
0.65%
Base
23–29%
0.90%
PressingCurrent
30–36%
1.32%
Confident
37%+
1.50%
How it works: worst streak = ceil(log(trades/mo) / log(1/lossRate)) · risk % = 5% ÷ worst streak. As your win rate improves, your worst realistic losing streak shortens — so the advisor lets you size up. When it slips, size drops automatically to protect your account.
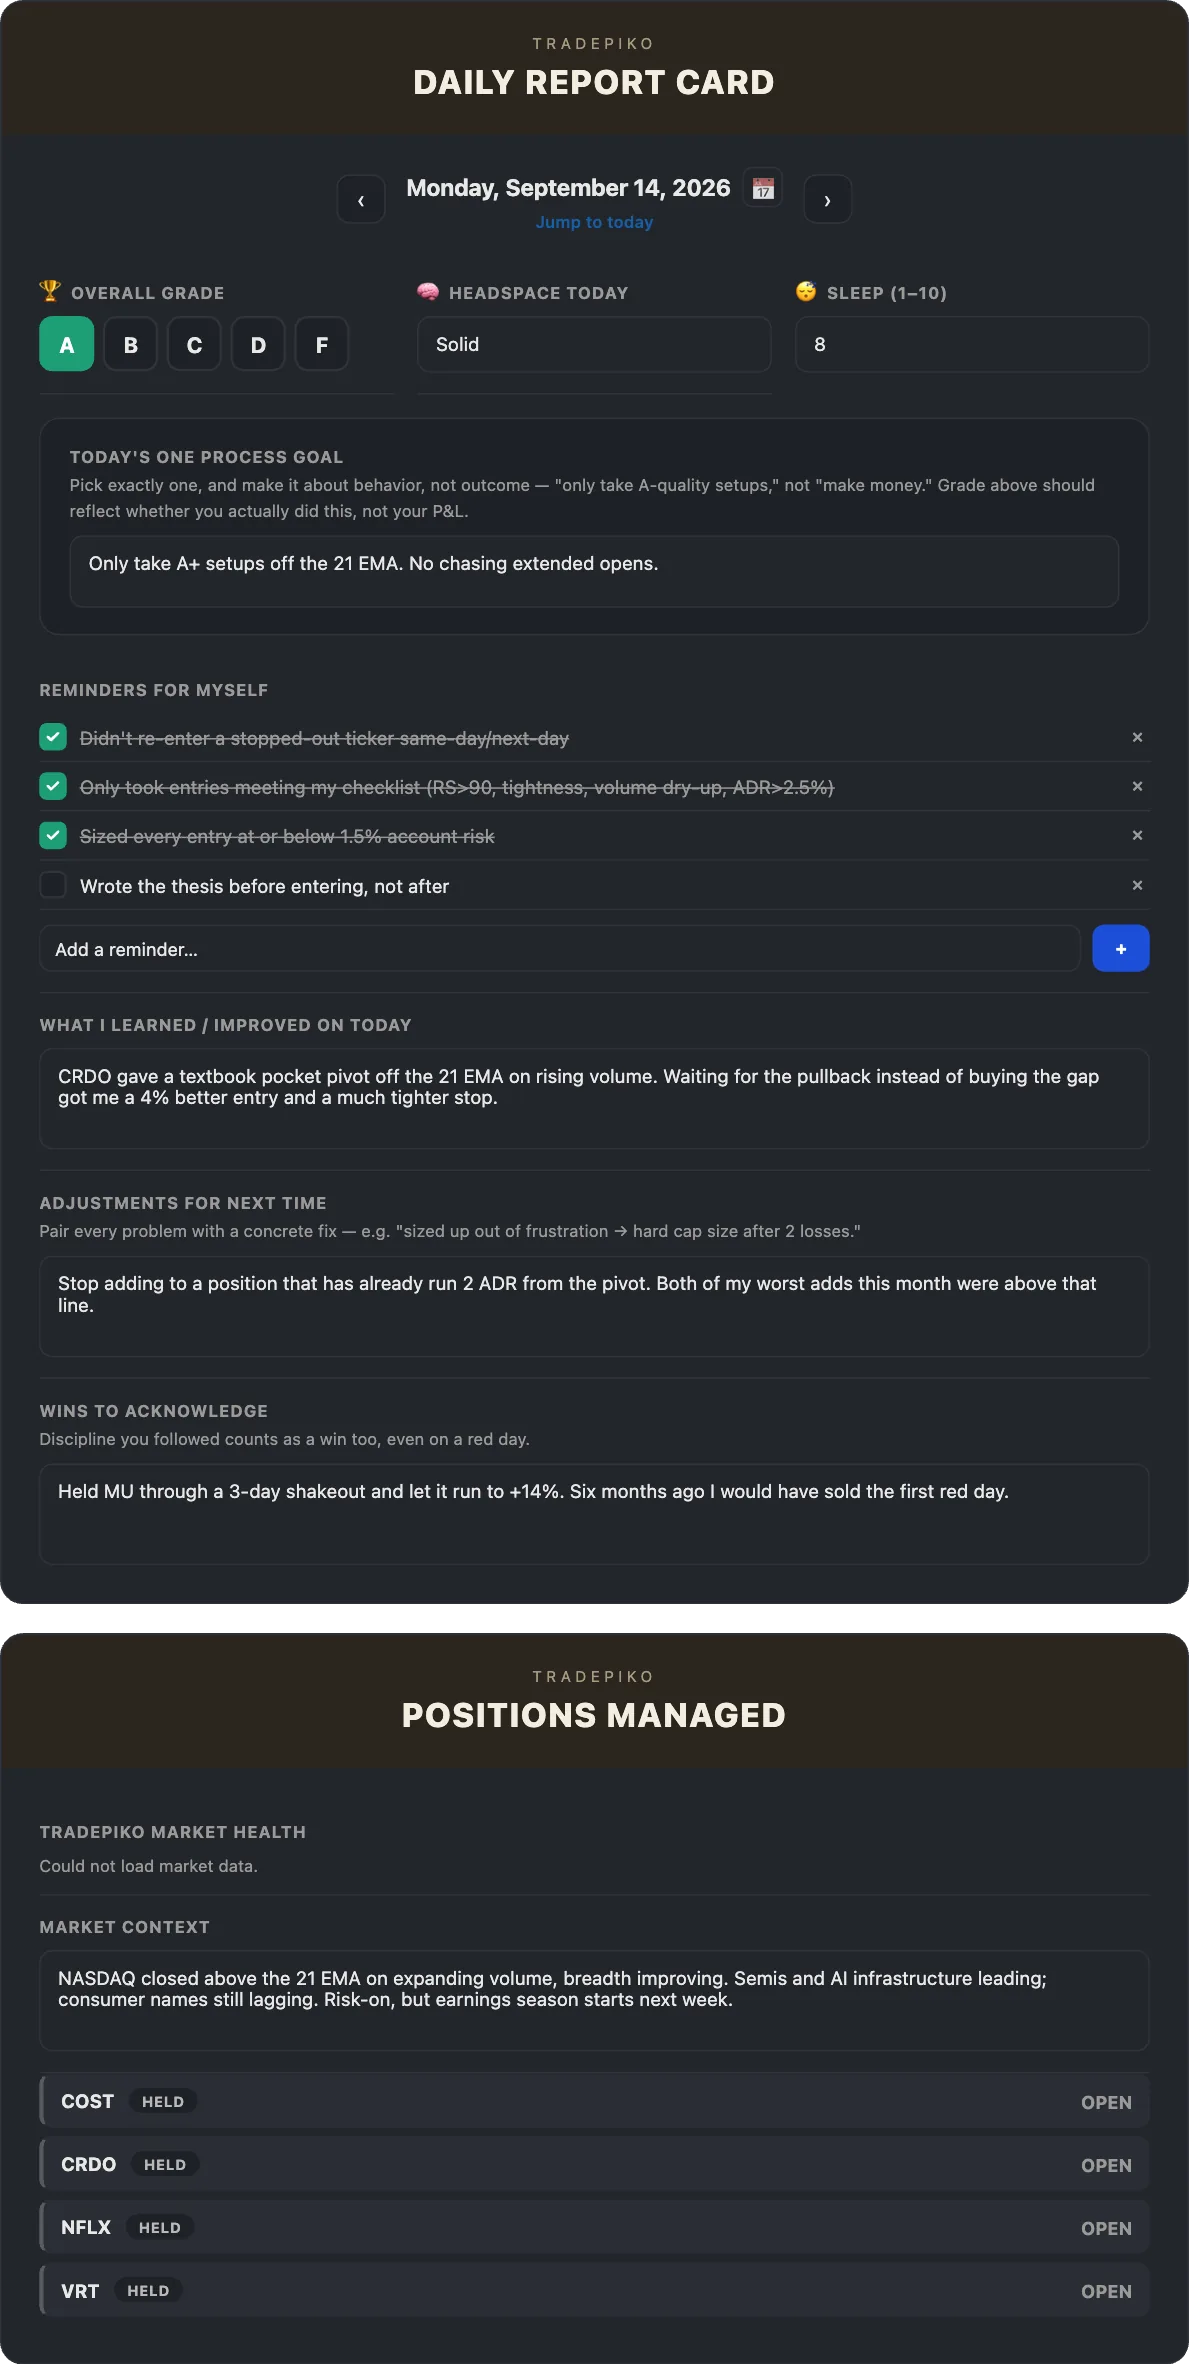
Report Card
YOUR TRADING,
GRADED.

Every month, quarter, and year gets its own report card — a real letter grade based on your P&L, win rate, and profit factor, plus the numbers behind it. See exactly how you performed, then share the result if you're proud of it.

Month, quarter, or year — pick any period and get a full breakdown, not just this month's numbers
A real letter grade — a weighted score from P&L, win rate, and profit factor, from A+ down to F
$ or % view — see every number in dollars or as a percentage of your account, your choice
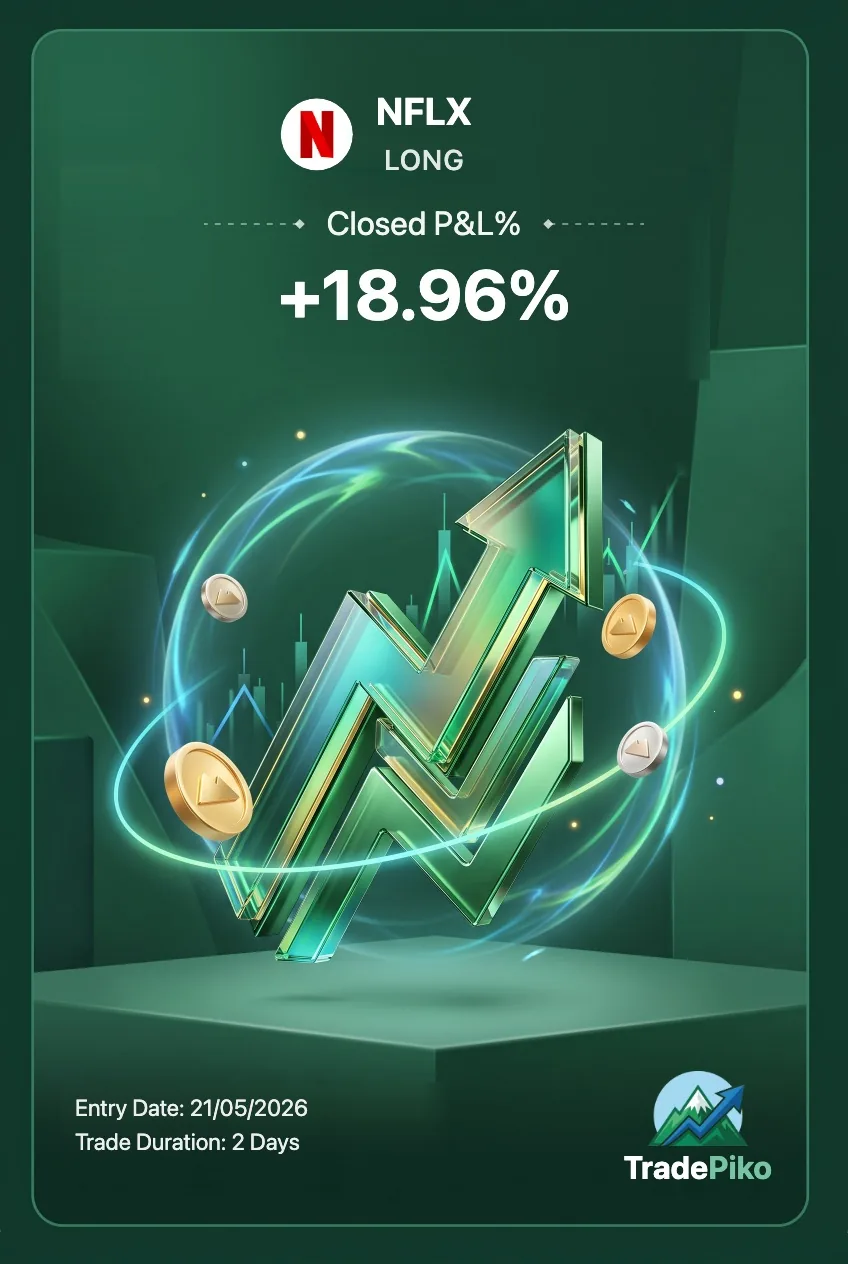
Share your results — export a branded image of your report card straight to X
TRADEPIKO
Report Card · March 2026
A+
+$4,215
31 trades · 61% win rate
Profit Factor
2.14
Max Win Streak
7
STOP GUESSING.
START KNOWING.

Join traders who use Tradepiko to understand their edge and trade with conviction.

See Plans & Pricing →