R-MULTIPLES, EXPLAINED.
An R-multiple measures a trade in units of the risk you took. 1R is what you lose if your stop gets hit.
It's simpler than it sounds. If your stop is 3% below your entry, then every 3% the stock moves is 1R. If you get stopped out, you made −1R. If the stock goes up 9% and you sell, you made +3R.
That's the whole idea. The rest of this post is that one rule applied to a few situations, and why it's a better way to judge your trades than percent or dollars.
How it works
Stopped out: −1R
Up 3%: +1R
Up 9%: +3R
Use the stop you set when you entered, not where you moved it later. If you trail the stop up to break-even, 1R is still the original 3%.
It works the same in dollars. If you'd lose $500 at your stop and the trade makes $1,500, that's +3R.
Lots of experienced traders measure trades this way and track their average R alongside win rate and profit factor. The idea was popularised by Van Tharp.
Shorts, partial sells and gaps
Shorts. Same idea, flipped. With a stop 3% above your entry, every 3% the stock falls is +1R, and getting stopped out is −1R. One extra hazard: there's no ceiling on how far a stock can gap up through your stop. See shorting stocks for swing traders.
Selling in pieces. Average the pieces. Sell half at +2R and half at +4R, and the trade made +3R.
A gap through the stop. A stop can't stop a stock from opening below it. If your stop is 3% away and the stock opens 6% lower after earnings, you lost 2R, not 1R. So "1% risk" only means 1% if the stop fills where you put it, and that's why holding through earnings needs its own decision. We cover it in how much to risk per trade.
Why R beats percent and dollars
Percent ignores the risk. A 20% gain sounds better than a 10% gain. But a 20% gain on a 10% stop is only +2R, while a 10% gain on a 2% stop is +5R. For the risk you took, the smaller gain was the better trade.
It's also why a tighter stop makes the same move worth more R. There's more on that in tighter stops, bigger size.
Dollars mix in your position size. Double the size and you double the dollars, but it's the same trade. The NET breakout in the position-sizing post made $393, $785 or $1,570 depending on the size, and +3.1R every time.
R puts everything on one scale. Cheap stocks and expensive ones, longs and shorts, small accounts and big ones. That's what makes expectancy, the break-even win rate and MFE and MAE comparable across your whole journal.
Average R is your expectancy
Add up the R of all your trades and divide by the number of trades. That's your expectancy: what you make per trade, on average, for each unit of risk.
Say you take 10 trades. Six get stopped out, for −6R. Four winners make +0.5R, +2R, +3R and +6.5R, for +12R. That's +6R over 10 trades, or +0.6R per trade.
Notice the shape. Most of the trades lost, and the one +6.5R winner made more than the whole +6R total. That's normal. Qullamaggie says most of his money comes from 10–20% of his trades (see outlier trades). It's also why 10 trades tell you very little. Judge a setup on 20–30 trades at the very least, as the expectancy post explains.
Planning targets in R
R also works before the trade. Once you know the stop, you know what each target is worth. A sell order 2R above the entry is a +2R trade if it fills.
Some traders plan their whole trade around R levels. For example, they move the stop to break-even at +1R and sell half at +2R.
The catch is that most trades never get far. Plenty of trades go 1R in your favour and then come back to the stop, and that's the case for selling a piece into strength.
It's also the case against selling everything at a fixed target. Only a few trades ever reach 5R or 10R, and those few are the ones that carry the result. A fixed 3R target sells every one of them at a fraction of what it could have made. Outlier trades looks at what taking profits early costs.
One more trap. An R target is measured in units of your stop, so the tighter the stop, the smaller the move it takes. On a 1.5% stop, 2R is only a 3% move, and that's often less than one good day for a fast-moving leader. Selling into strength compares time-based and R-based partials.
Using R in your own journal
- Record the initial stop on every trade. Without it there's no R. A journal that only stores entry and exit can give you percent and dollars, but not R. If your journal reads it from your broker, check it picked the stop you meant; how TradePiko tracks R multiples explains TradePiko's rule.
- Report averages in R, not dollars. Average win, average loss and expectancy in R can be compared month to month as the account and your size change.
- Watch your losses beyond −1R. Gaps explain some of them. The rest are stops that were moved, placed late or not placed at all, and that's a discipline problem you can count. Trading psychology for swing traders covers how.
- Look at the tail. How many of your trades reached 5R or 10R, and what did you do with them? If none ever do, either the setups or the exits are capping you.
Every trade in R, from your broker history
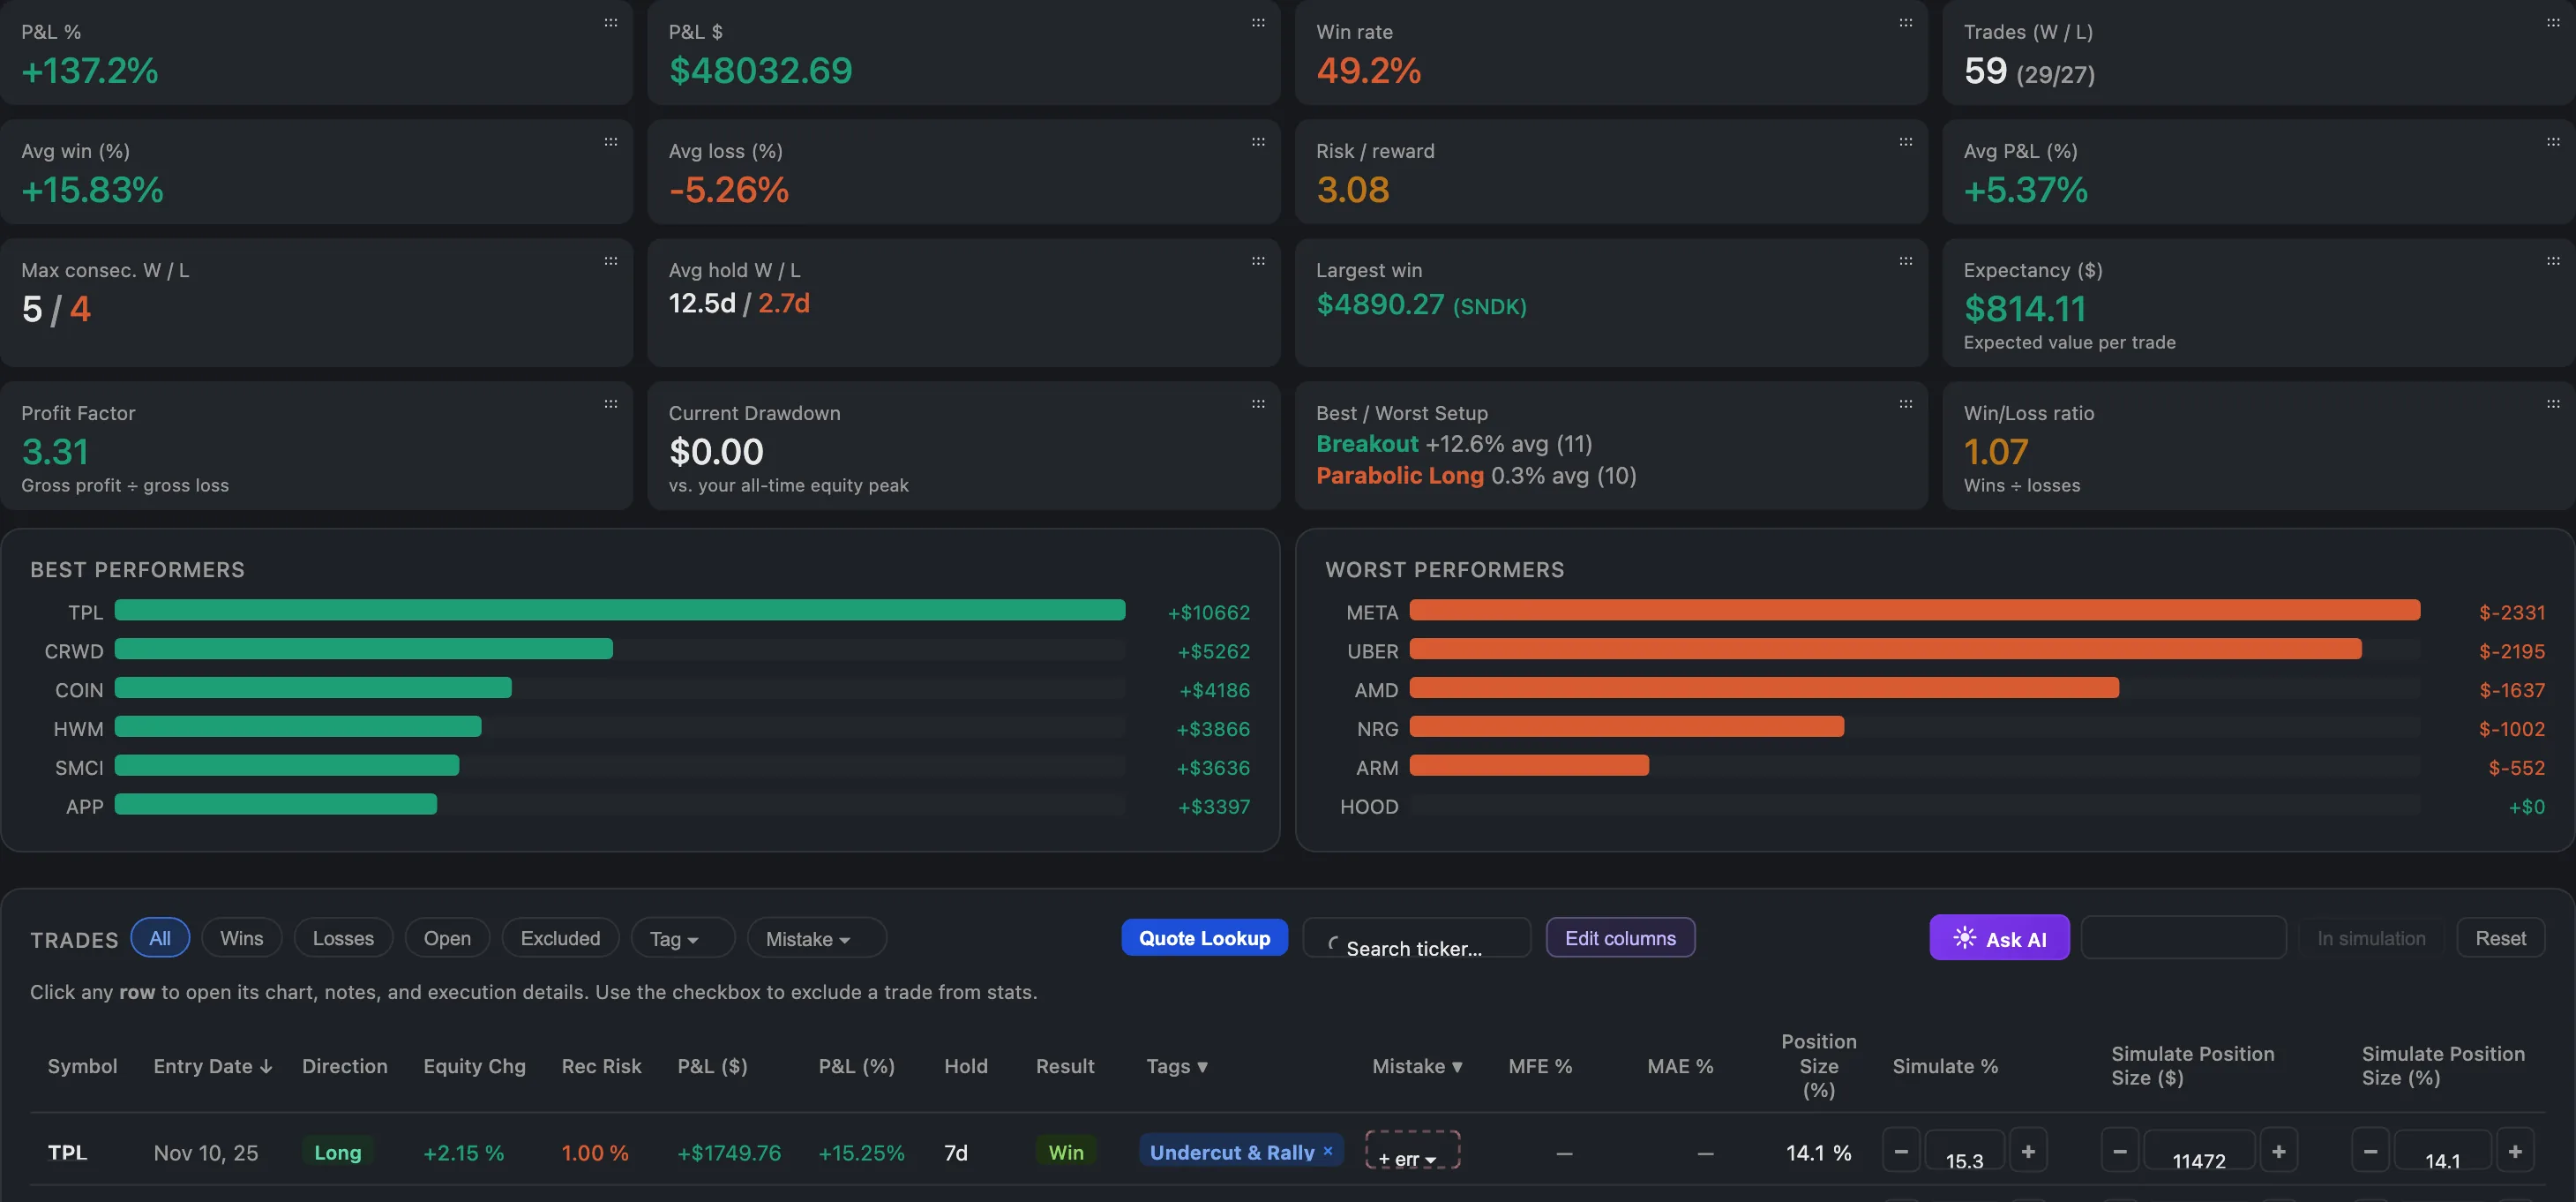
The examples above are hypothetical. Your own R profile, how big your losses really are and how far your winners run, is in your trade history, and TradePiko measures it:
- R on every trade. TradePiko reads each trade's initial stop from your broker's stop orders and shows its R multiple, with Add SL for any trade it can't find a stop for.
- Expectancy, average win and average loss. Calculated across your whole journal and updated as new trades sync from 40 brokerages.
- MFE and MAE on every trade. See how far each trade ran before you sold, and how often your trades reach 2R, 3R or 5R.
- Every trade on its daily chart. Entry and exit plotted, so a loss beyond −1R shows whether it was a gap or a stop you didn't honour.
- Trade Simulation. Split past trades into a partial and a runner, or cap losses with Cut Losers Faster, and compare against what you actually did.
Sources and credits. Measuring trades as multiples of initial risk was popularised by Van Tharp. Qullamaggie's point that most of his money comes from 10–20% of his trades is from his Chat With Traders interview; his breakout rules are from My 3 timeless setups. Some ideas are adapted from public trader interviews and notes. The trade examples are hypothetical, apart from the NET trade from the position-sizing post. Educational content only.