ADR%: THE ONE VOLATILITY NUMBER.
A 3% stop isn't one thing.
On a stock that moves 1.5% a day, it's two days of ordinary movement. On one that moves 10% a day, it's a third of a single session. ADR%, the average daily range, is the number that tells you which situation you're in.
It's the average of each day's high divided by its low, minus one, over the last 20 sessions. In other words, how far the stock normally travels in a day, as a percentage, so a $15 stock and a $500 one sit on the same scale.
Swing traders lean on it for five jobs:
- It screens out stocks that move too little (many traders want 4–5% or more).
- It caps the stop at one ADR or less.
- It explains why the same dollar risk can buy four and a half times as many shares of one stock as another.
- It flags entries stretched more than about 2.5 ADRs above the moving average.
- It tells you whether a base is genuinely tight for that stock.
On October 23, 2026, Coca-Cola's ADR was 1.5% and Moderna's was 10.5%, about seven times as much. Every one of those jobs comes out differently on the two.
What ADR% measures
Every trading day has a high and a low. Divide the high by the low, subtract one, and you have that day's range as a percentage. Average the last 20 of those and you have the stock's ADR%:
ADR% = average of (high ÷ low − 1) for each of the last 20 days
It answers a simple question: on an ordinary day, how far does this stock travel from bottom to top?
A stock with a 2% ADR covers about 2% a day. A stock with an 8% ADR covers about 8%. And because it's a percentage, it doesn't care whether the stock costs $15 or $500, so you can line up very different names side by side.
Twenty days is the usual window. That's about a month of trading, which is long enough to smooth out one wild session and short enough to notice when a stock's character changes. In a spreadsheet, the whole thing is one column of =high/low-1 and a 20-row average.
ADR vs ATR and ATR%
If you've used charting software, you've probably met ATR (average true range) first. It's a close relative, with two real differences.
- ATR is in dollars. It averages each day's "true range", which is the largest of today's high minus low, today's high minus yesterday's close, and yesterday's close minus today's low. The default window is 14 days. A $6 ATR tells you little until you know the share price, which is why traders divide it by the price to get ATR%.
- ATR counts gaps; ADR doesn't. If a stock closes at $100 and opens the next morning at $94, ATR includes that $6 gap. ADR only looks at the range inside each session. On a stock that gaps a lot, ATR% runs higher than ADR%.
For most stocks on most days, the two tell the same story. They part company on stocks that gap a lot, where ATR% runs noticeably above ADR%.
ADR% is the one most momentum traders quote, because it's simple, it's already a percentage, and it describes the moves you can actually trade during the session.
Job 1: a minimum-volatility filter
The first thing ADR does is tell you what to ignore.
If a stock only moves 1–2% a day, it rarely produces the 20–50% runs that make breakout trading pay, and the trade ties up a lot of capital for very little movement. Common thresholds:
- A common checklist asks for an ADR of at least 3%, and ideally 4–5% or more; Qullamaggie suggests 5%+ for small accounts.
- Some fast-stock traders stick mainly to names with an ADR above 5%.
- Our breakouts guide sets no hard minimum, but its results (below) make a strong case for 5% or more.
The logic behind the filter is J. Paul Getty's line "go where the oil is". Hendrik Bessembinder's finding that about 4% of US stocks produced all of the market's net gains from 1926 to 2016 makes the same point, and Qullamaggie's scans start from the top 1–2% of performers over one, three and six months.
The big moves are concentrated in a few names, and a stock that barely moves in a day is unlikely to be one of them. A 20% move is four ordinary days for a 5% ADR stock, and more than 13 for a 1.5% one.
You might expect the filter to make no difference once everything is measured in R. R is already scaled to the stop, so in theory a quiet stock with a tight stop and a fast stock with a wide one could earn the same R per trade. In our test they didn't, and the fast stocks won more often too (more on that below).
The filter earns its keep in capital, not hit rate. The quiet stock needs a much bigger position to risk the same dollars, which is the third job.
The other end matters too. Very high ADRs (10%+) can be hard to handle, with wider stops in percent, faster reversals and bigger gaps. Some experienced traders say high-ADR stocks have cost them money on balance.
You can think of it as a choice between trend followers and range expanders. Pick a range you can actually sit through.
Job 2: a cap on the stop
A stop that sits inside a stock's normal daily noise will get hit by noise. A stop much further away than a day's range means you're risking a lot per share and buying few shares. ADR gives you a ruler for both ends.
- The ceiling: no wider than 1 ADR. Qullamaggie's breakout entries put the stop at the low of the entry day, and never wider than the stock's average daily range. If the day's low is further away, skip the trade or tighten to one ADR.
- A tighter cap: ½ ADR. Some traders cap stops at half the ADR, so a 5% ADR stock gets a stop no wider than 2.5%. There's more on when that works in the half-ADR stop.
Job 3: sizing
Once the stop is set, the share count follows from it. (The full maths of why a tighter stop means more shares for the same risk is in why a tighter stop can mean far more upside, so we won't repeat it here.) What ADR adds is the reason the same 1R can look so different from one stock to the next.
Put the stop one ADR below the entry, and the position size, as a share of the account, is simply your risk per trade divided by the ADR.
At 0.5% risk, a 2% ADR stock needs a 25% position. A 5% ADR stock needs 10%, and a 10% ADR stock needs 5%. So two stocks at the same share price can need position sizes five times apart.
That's why the minimum-ADR filter and position limits go together. Qullamaggie keeps most positions at 10–20% of the account, and never more than 30% in one name overnight.
With a one-ADR stop, a 2% ADR stock already needs a 25% position to risk 0.5%. Tighten that stop and it breaks the limit. A low-volatility stock doesn't just move less. It forces you to concentrate to make the risk worth taking. See position sizing for swing trading for how to set those limits.
Job 4: how extended is too extended
A stock 10% above its 10-day moving average means very different things depending on the stock. For a 1.5% ADR mega cap, that would be a historic move. For a 10% ADR name, it's one busy day. Measuring extension in ADRs puts every stock on the same scale:
(price ÷ moving average − 1) ÷ ADR%
A common upper limit for new entries is about 2.5 ADRs of extension. A similar rule uses ATR%: names more than 4× ATR% above the 50-day stay off the focus list.
Holding a winner that gets extended is fine. But opening a new position there means your logical stop is a long way below, your share count is small, and a normal pullback to the moving average costs you a full R.
Job 5: judging tightness against the stock's own range
This is the subtle one, and for breakout traders, maybe the most useful.
A "tight" base has to be tight for that stock. A 3% day is a quiet day for a 6% ADR stock and a violent one for a 1.5% ADR mega cap. So measure the contraction against the stock's own ADR, not an absolute number. Picture a stock with a 16% ADR whose daily ranges compressed to about 9% over three days before it broke out.
The idea underneath is the volatility contraction Mark Minervini describes. Ranges shrink from left to right as sellers dry up, and a short, tight pivot near the highs makes the risk easy to define. ADR turns "tight" from an impression into a measurement.
Here's a simple way to use it on any chart:
- Count how many of the last 5–10 base days ranged below the ADR. Most or all of them is what you want.
- Look for a few days at roughly half to two-thirds of the ADR near the right side of the base.
- On the breakout day, look for a range of well over one ADR, ideally the widest bar in the last 5–10 sessions.
Remember that ADR is a trailing 20-day average, so it drifts down during a long, quiet base. Compare the base days with the ADR going into the base, not only with today's figure.
Common mistakes with ADR
- Using a fixed percentage stop for every stock. A 3% stop is half an ADR on one name and two ADRs on another. Express stops in ADRs first, then convert to price.
- Ignoring the news. One earnings gap or a 30% day can inflate the 20-day ADR for a month. Check whether the average is being carried by one outlier day.
- Forgetting it changes. ADR isn't a property of the company. It rises in hot markets and falls in quiet ones, so recheck it on the day you trade.
- Treating high ADR as a reason to buy. It's a filter, not a signal. The setup still has to be there.
What ADR looks like across the market
Here are real ADRs for a few slow, heavily owned names, and for some of the stocks on the PIKO 50 momentum list the same week:
| Stock | Type | Close | ADR% | ATR% |
|---|---|---|---|---|
| SPY | S&P 500 ETF | $759.97 | 0.8% | 0.9% |
| BRK-B | Mega cap | $542.19 | 1.1% | 1.2% |
| KO | Mega cap | $92.71 | 1.5% | 1.8% |
| AAPL | Mega cap | $347.73 | 1.8% | 1.8% |
| MSFT | Mega cap | $524.51 | 2.0% | 2.1% |
| NVDA | Mega cap | $210.96 | 2.3% | 2.8% |
| CRWD | PIKO 50 #3 | $257.57 | 4.7% | 5.3% |
| ZS | PIKO 50 #12 | $255.15 | 5.1% | 4.9% |
| OKTA | PIKO 50 #10 | $213.05 | 5.5% | 5.8% |
| MSTR | PIKO 50 #2 | $146.01 | 6.1% | 6.7% |
| IOVA | PIKO 50 #24 | $14.09 | 7.2% | 6.7% |
| GRAL | PIKO 50 #35 | $132.55 | 8.5% | 8.3% |
| TXG | PIKO 50 #20 | $71.55 | 9.3% | 10.7% |
| TWST | PIKO 50 #14 | $139.92 | 10.0% | 11.7% |
| MRNA | PIKO 50 #1 | $200.10 | 10.5% | 11.7% |
As of the close on October 23, 2026. ADR% = 20-day average of high ÷ low − 1. ATR% = 14-day simple average of true range ÷ close. PIKO 50 ranks from the October 23 list.
The gap is enormous. Every one of the 50 names on that night's PIKO 50 had an ADR of at least 4%, and the middle of the list sat at 5.0%. Not one of the six slow names reached 2.5%.
That difference is the whole reason momentum traders look where they look. A 20% move is more than 13 times KO's average day, and only about three times a 6% ADR stock's.
MRNA's 10.5% ADR was about seven times KO's 1.5% that night.
The ATR column shows the gap effect from earlier in real numbers. Twist Bioscience (TWST) gapped down between 4.9% and 6.8% at the open three times in the 14 sessions to October 23, 2026, and its ATR% (11.7%) ran well above its ADR% (10.0%). Coca-Cola, which barely gaps, came in at 1.8% and 1.5%.
Worked example: BMNR's August 2026 breakout
One breakout shows most of the jobs at once. Through late July 2026, BMNR was routinely covering 7–10% a day. Then it based for 12 sessions in August, and every single day ranged less than its ADR of about 6%. That's exactly the contraction Job 5 looks for: sellers drying up and the stock coiling.

It broke out of the base on a range more than twice its ADR, on heavy volume. The buy came at the base top and the stop at the day's low, which sat inside one ADR, so it passed Job 2. On breakout day it closed well inside the Job 4 extension limit, but a few sessions later it was far past it, too stretched for a fresh buy even though the chart still looked strong. With a third sold on day five and the rest trailed on the 10-day average, the trade made +4.9R.
Sizing across the volatility range
Take a $100,000 account risking 0.5% per trade, or $500, and put each stop exactly one ADR below the October 23 close:
stop distance = $210.96 × 2.27% = $4.79
$500 ÷ $4.79 = 104 shares = $21,940 (21.9% of the account)
MRNA: ADR 10.46%, close $200.10
stop distance = $200.10 × 10.46% = $20.93
$500 ÷ $20.93 = 23 shares = $4,602 (4.6% of the account)
That's two stocks at almost the same share price and the same $500 at risk. Yet you'd hold about 4.5 times as many shares of one as the other, in a position nearly five times the size. Here's the same calculation across the volatility range:
| Stock | ADR% | 1-ADR stop | Shares for $500 | Position |
|---|---|---|---|---|
| NVDA | 2.3% | $4.79 | 104 | $21,940 (21.9%) |
| CRWD | 4.7% | $12.11 | 41 | $10,560 (10.6%) |
| GRAL | 8.5% | $11.24 | 44 | $5,832 (5.8%) |
| MRNA | 10.5% | $20.93 | 23 | $4,602 (4.6%) |
$100,000 account, 0.5% risk, stop one ADR below the October 23, 2026 close. Shares rounded down.
Does the filter raise your win rate?
In our own 544-trade breakout test, it did more than that. The test took breakouts across about 600 liquid US stocks with no ADR filter at all.
The 139 trades in stocks with an ADR of 5% or more won 35% of the time and averaged +1.64R per trade, +228R in total. The 351 trades under 4% (which included lots of calm large caps) won 26% of the time and roughly broke even, at +0.04R per trade. The 54 trades in between averaged +0.27R.
So the fast stocks, a quarter of the trades, made almost 90% of the test's profit. The slow ones made next to nothing, even though R is already scaled to each stop.
A calm stock with a tight stop can break out cleanly and still never move far enough to pay for the losers around it. That's the case for the filter in one line: put your capital where the movement is.
The usual caveats apply. It's one 18-month period, the universe was built from today's index members, and like every breakout plan, the result leans on a handful of big winners.
Put ADR to work on your own trades
ADR is easy to calculate and easy to forget. TradePiko keeps it in front of you, and lets you check whether your stops actually fit the stocks you trade:
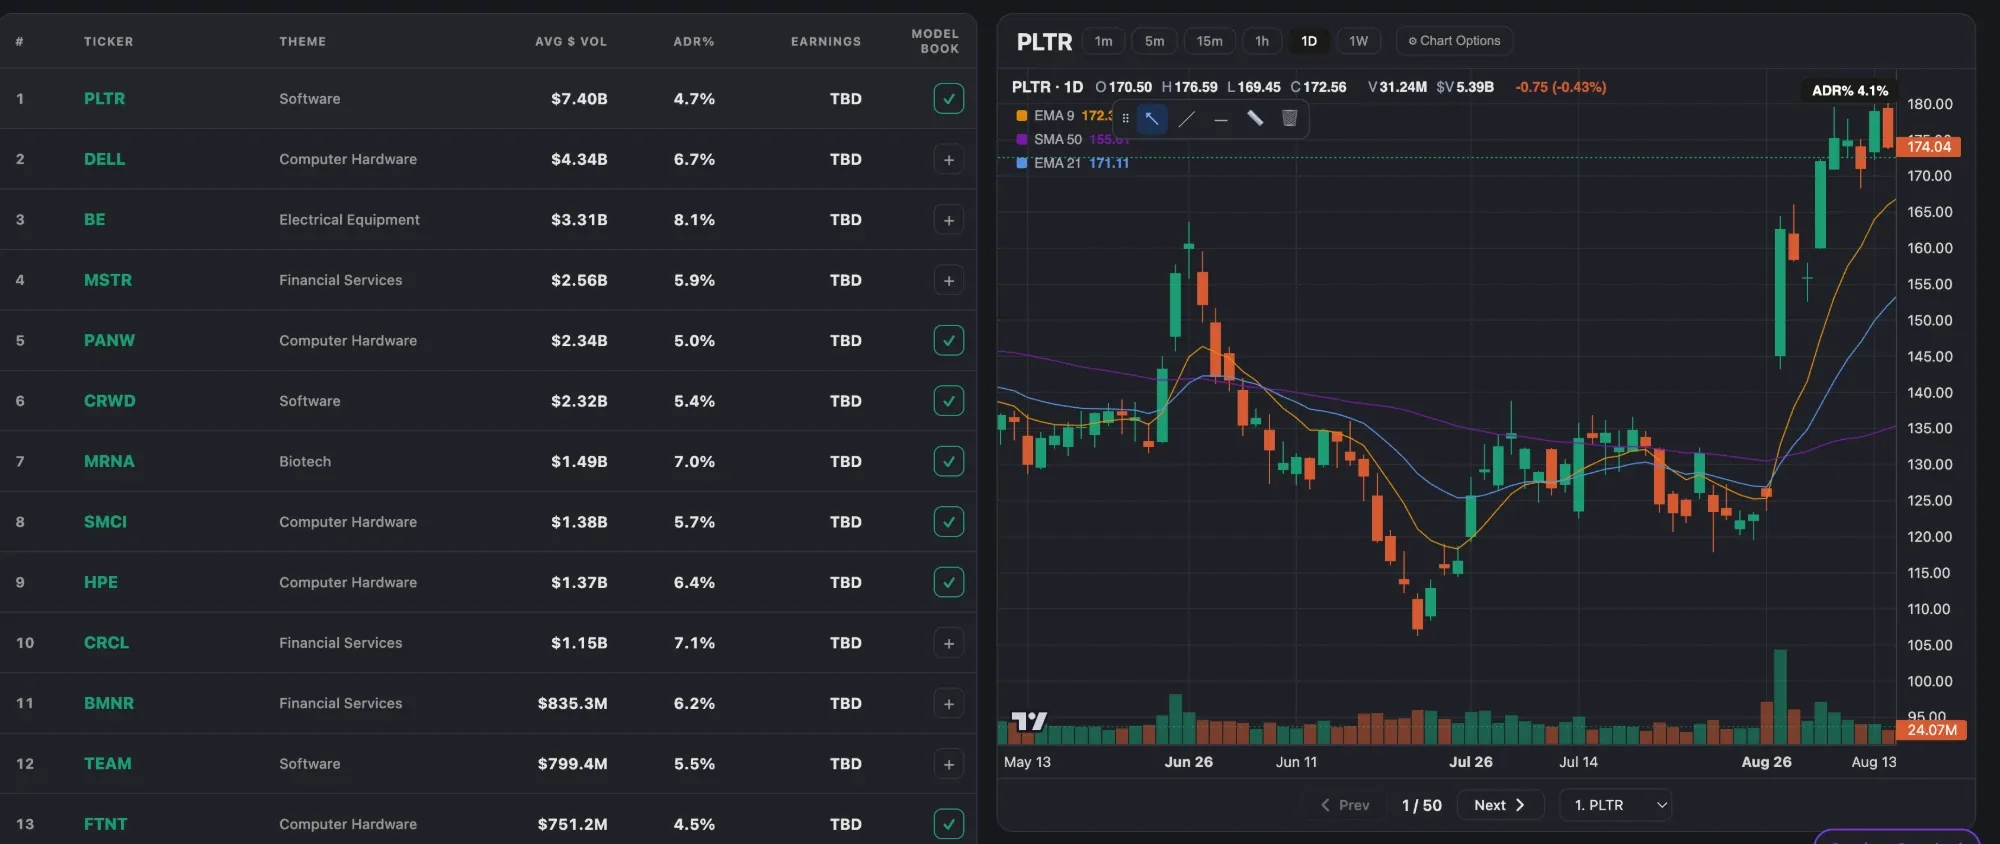
- The PIKO 50. Every night's top-50 momentum list shows each stock's ADR% next to its average dollar volume and earnings date, so the minimum-volatility filter is already done.
- Position Sizing Advisor. Work out the share count from your account risk and your stop before you place the order, so a quiet stock never sneaks in at a position size you didn't intend.
- MFE and MAE on every trade. See how far each trade went against you before it worked. If your winners never dip more than half an ADR, you have evidence for a tighter stop. If they routinely dip a full ADR, you don't.
- Every trade on its daily chart. Look back at the bases you bought and ask whether the days before your entry were really tight for that stock.
Sources and credits. The low-of-day stop, never wider than the stock's average daily range, and the 10–20% position guideline with a 30% overnight maximum are from Kristjan Kullamägi (Qullamaggie), My 3 timeless setups that have made me tens of millions. Volatility contraction is Mark Minervini's concept. The 4% figure is from Hendrik Bessembinder's study of US stock returns. ATR was introduced by J. Welles Wilder. The 544-trade breakout test is TradePiko's own and is illustrative, not a guarantee of future results. Some ideas are adapted from public trader interviews and notes. Educational content only.