HOW TO TRADE BREAKOUTS.
A breakout trade is a bet that a stock which has already shown it can move is about to do it again.
The setup comes in three parts. First, a leading stock makes a big run, usually 30–100% or more in one to three months. Then it rests in a tight, orderly base for somewhere between two weeks and two months. And then it pushes out of that base on a wide-range, high-volume day. That's where you buy.
What makes it worth learning is the shape of the risk. You buy as the stock clears the top of the base, and your stop goes at the low of the breakout day (never wider than the stock's average daily range). So when the trade fails, you lose a small amount you knew about in advance. When it works, you sell a third to a half after 3–5 days and trail the rest with the 10- or 20-day moving average, and one trade can pay you many times what you risked.
That asymmetry is the whole game. In our own test of 544 breakouts, the strategy won only 29% of the time, and the best 10 trades made more than the entire profit.
Why breakouts work at all
The biggest winners in any market don't go up in a straight line. They climb in steps.
There's a sharp run of 20–50% or more. Then a few weeks of going sideways, while the early buyers take profits and the stock digests the move. Then another run. A breakout trade is simply an attempt to get on board right as the next step starts.
The base matters because that's where the risk gets small. If a stock has spent three weeks in a narrower and narrower range, it has shown you exactly where buyers keep stepping in. When it finally leaves that range with force, you can enter close to that support, which means you find out quickly (and cheaply) if you're wrong. You lose a little when it fails. When it works, the stock can run many times your risk.
That's why Qullamaggie, whose framework this post follows, has said he's profitable at a 25–30% win rate. His losses stay small, and his winners run to 5R, 10R or more.
Step 1: find the stocks that are already leading
Breakouts work best in stocks that are already outperforming the market. When a stock has been lagging, a breakout from its base usually doesn't get far.
The sweet spot is the strongest few percent of the market: roughly the top 1–2% of stocks by performance over the last one, three and six months. And the order matters here. Relative strength comes first, and the chart pattern comes second, not the other way around. Qullamaggie adds that the stock should also have a reason to go up, like accelerating earnings. A neat pattern on a random stock is rarely worth the trade.
Two practical filters go with this. You need enough daily range for the move to be worth your time, which means an average daily range (ADR) of about 4% or more, and ideally 5%+. And you need enough liquidity to get in and out at the price you expect. If a leader only trades a few hundred thousand dollars a day, you can't really size into it.
Step 2: the prior move
Every good breakout starts with a big move: 30% to 100% or more within the previous one to three months, and often over just days or a few weeks. That move is your proof that big money cares about this stock right now.
It's also the step people skip most often. A tidy-looking base after a 10% drift higher might look the same on a chart, but it isn't the same setup. Without the prior move, there's no evidence of demand. There's just a pattern.
If the move started with a gap on news, even better. Breakouts that follow a recent episodic pivot tend to have better odds, because the breakout extends the drift a positive surprise tends to leave behind. (More on that in episodic pivots.)
Step 3: the base
After the move, you want the stock to rest, not collapse. Here's what a constructive base usually looks like:
- Length: about two weeks to two months.
- Higher lows: each pullback stops a little higher than the last one.
- A tightening range: the daily bars get smaller and quieter toward the right side of the base, and volume dries up.
- Surfing the moving averages: price holds above a rising 10- and 20-day moving average (sometimes the 50-day), and the 10-day stays above the 20-day.
- Depth: shallow compared with the move before it.
Qullamaggie describes the ideal base as orderly. A momentum stock will often give back around a third of its run, find support at the 10- or 20-day line, and then make higher lows above it as it tightens up. Most stocks don't find support at all after a big run, so when one does, it's showing you strength.
One refinement that helps a lot: judge "tight" against the stock's own volatility, not some absolute number. If a stock normally moves 7% a day and has just printed three 3% days, it's coiling, even though a 3% day would be perfectly normal for a utility.
Step 4: the entry
A base is a setup. It isn't a trade yet.
For that you need a trigger: the moment the stock actually starts to leave the range. There are a few common ways to catch it, and they mostly trade off getting in early against avoiding false starts:
- Opening-range high. On the breakout morning, you buy when price clears the high of the first 1-, 5- or 60-minute candle. Shorter timeframes get you in earlier with a tighter stop, while longer ones filter out more false starts.
- Through the top of the base. You place a buy-stop just above the base high. It's the simplest version, and it's the one we use in the examples below, because you can check it from daily data.
- Break above the prior bar's high. Once the base has gone quiet, you buy as soon as price trades above the previous day's high (or the previous bar's high on a shorter timeframe). It often gets you in a little before the base high breaks, with the stop at the low of that day or the prior bar, so the risk stays tight. The catch is that a quiet stock pokes above yesterday's high all the time, so it works best when the bars are already small and tight.
- Break above a trendline. If the base has been drifting lower in a controlled way, draw a line across its highs and buy when price breaks above it. Look for a line that touches at least three highs: two touches can be a coincidence, but three or more is a line other traders are watching too. Waiting for a daily close above the line filters out most false breaks, but you'll usually pay a higher price for it. This often triggers earlier than a break of the base high, which means a better price but more failed attempts.
None of these is "the right one". They're different points on the same trade-off, and there's a full rundown in swing trading entry techniques.
Either way, what you want to see on the day is range expansion: a daily bar that's the largest of the last 5–10 sessions, on clearly higher volume than normal.
Traders tune the trigger to their own temperament. A slower version waits 30 minutes after the open (unless volume is extreme), uses the 30-minute opening-range high, and passes on the trade if the day's low is already more than 60% of the ATR away. Qullamaggie, on the other hand, will buy again if he's stopped out and the stock retakes the highs minutes later, even at a higher price. There's more on those trade-offs in opening-range high entries.
Two things to avoid. Don't chase a stock that's already stretched far above its moving averages on the trigger day; many traders refuse entries more than about 2.5 ADRs above the 10-day line. And don't buy in anticipation of a breakout until the plain version is working for you. Anticipating gets you a better price, but it fails more often.
Step 5: the stop, and how many shares
Your stop goes at the low of the breakout day. If that's further away than the stock's ADR, either skip the trade or tighten the stop to one ADR.
Once you know the stop, it decides your position size:
For this style, risking 0.25% to 1% per trade is the usual range. A couple of common guardrails go with it: keep most positions at 10–20% of the account, and never hold more than about 30% in a single name overnight. If a position would have to be bigger than that to reach your risk budget, that tells you something. Either the stop is too tight for the stock, or the risk budget is too big for the account. (The full method is in position sizing for swing trading.)
And once the stop is set, it's not up for debate. If it's hit, you sell. Qullamaggie's point is that hesitating is how a one-unit loss turns into two or three, and the setup only works as long as your losses stay small.
Step 6: selling
The classic breakout exit has two parts:
- Sell a third to a half after 3–5 days of follow-through, and move the stop on the rest to break-even. From that point the trade can't turn into a loss.
- Trail the rest with a moving average, and get out on the first close below it. The 10-day line keeps more of the gain on fast, steep moves, while the 20-day gives the stock more room and rides longer trends. If you're newer to this, the 10-day is the simpler place to start.
Notice that it's the close that counts, not an intraday dip below the line. Qullamaggie points out that intraday undercuts of the moving average are common, and they often shake people out right before the trend carries on.
Here's the tricky part. The looser your exit, the more a winning trade will make. That's always true of a trade that worked, which is exactly why you can't pick an exit rule by looking at your best trade. The partial sale is there for the trades that pop for three days and then reverse, and those are far more common than the big runners. What's right for you depends on your own trades, and that's something you can actually test (more on that below).
Why most breakouts fail
Breakouts fail for a handful of recurring reasons, and most of them are visible before you ever buy:
- The market is against you. Breakouts work in healthy uptrends and fail in choppy or falling markets, where the same setup that paid 5R in April gets stopped out three times in a row in September. Qullamaggie says they work best as the index comes out of a 5–15% correction into an uptrend or a sideways market. (See why market environment matters more than your setup.)
- No real prior move. A base without a big advance before it is just a range.
- A loose, sloppy base. Wide, overlapping bars and lower lows mean the selling hasn't dried up yet.
- A weak trigger. A breakout on an ordinary-sized bar and average volume hasn't shown you any real demand.
- Too extended. If the stock is already stretched far above its moving averages, your stop ends up too far away, or there's nowhere sensible to put one at all.
- A late-stage base. The third or fourth base in a long advance fails more often than the first or second.
Volume comes with a caveat, though. Breakouts sometimes work on light volume, and stocks sometimes top on a huge-volume breakout, because the bigger holders are selling into all those buyers. A parabolic spike in volume is better read as a warning of a blow-off top than as confirmation.
And when a breakout falls straight back into the base on the same day, treat it as information, not just a loss. If the market is handing you a lot of those, it's telling you to trade smaller, or not at all.
Breakout trading mistakes to avoid
- Moving the stop down "to give it room". The whole edge depends on keeping losses small.
- Selling everything at +1R or +2R. That cuts off the outliers that pay for everything else.
- Buying every chart that looks like a flag, whether or not the stock is a leader. Stick to the top few percent.
- Judging the setup on five trades. With a 30–50% win rate, five losses in a row is routine. Give it at least 20–30 trades, and judge it on the R-multiples rather than the hit rate. (See why a 40% win rate can beat 70%.)
A real trade: ARM in spring 2026
Arm Holdings (ARM) had all three parts in spring 2026. It was already one of the market's leaders, it more than doubled in about six weeks into late April, and then it rested for 17 sessions in a shallow base, with the lows stepping up inside it.

In late May it pushed out of the base on a wide-range day, almost twice its ADR, on far heavier volume than normal. The buy came at the top of the base and the stop went at the low of the breakout day, comfortably inside one ADR. A third was sold on day five with the stop on the rest moved to break-even, and the rest rode the 10-day moving average until the first close below it in early June, for +7.5R. Trailing on the 20-day instead would have made more, but that's what a winner always shows you, which is why one great trade can't choose your exit rule.
What 544 breakouts actually look like
One great chart proves nothing.
So we turned the rules above into a strict test that behaves like one active trader. We scanned 598 liquid US stocks (today's S&P 500 plus well-known momentum names) from May 2025 to October 2026, looking for a 30%+ prior move into a 10–40 day base no more than 30% deep, with higher lows, a tighter last week and the 10-day above the 20-day. Every rule only uses data known at the prior close, so nothing peeks ahead.
The entry is intraday: the first hourly bar that reaches the base high buys there (or at the open, if the stock gaps above it). The stop is the low of the day known at that moment, never tighter than a third of the stock's ADR, and any breakout whose stop would sit more than one ADR away gets skipped. If the stock falls back through that low later the same day, the trade is stopped out on day 1, which turns out to be the most common way a breakout fails.
The account holds at most 10 positions, so when more signals show up than there are free slots, some get skipped, just like they would for a real trader. That gave us 544 trades in 259 stocks, about 30 a month. Each one sold a third at the close of day 3, moved the stop to break-even, and trailed the rest until the first close below the 21-day EMA.
| Outcome | Trades | Total R | Share of the 544 trades |
|---|---|---|---|
| Full stop, about −1R or worse | 364 | −404.5R | |
| Smaller loss | 24 | −8.1R | |
| Scratch (0 to 0.5R) | 39 | +9.5R | |
| 0.5R to 2R | 56 | +56.7R | |
| 2R to 5R | 26 | +83.6R | |
| 5R to 10R | 16 | +121.3R | |
| 10R or more | 19 | +399.3R |
544 breakouts, May 2025 to October 2026: daily and 60-minute bars, at most 10 positions open, no commissions or slippage. The ARM trade above is a worked example, not part of this test: with the test's tighter intraday stop and full account, it never made the list.
Four things stand out, and honestly, they're the real lessons of breakout trading.
Most trades lost. 364 of the 544 hit the full stop, and 168 of those were stopped out the same day they were bought. The plan won only 29% of the time, yet it still made +258R (about +0.47R per trade), because the average winner (+4.3R) was four times the size of the average loser. At those averages, you'd break even winning about 20% of the time. So getting stopped out is the normal outcome. It isn't a sign the setup is broken.
A handful of trades did all the work. The best 10 trades made 294R, which is more than the whole 258R total. Take them out and the year finishes about 36R in the red. 19 trades returned 10R or more, led by 10x Genomics at +66R and Marvell at +52R. That's why you take every valid setup, and why you never cut a winner short just to "lock in" 2R.
Slower trails caught more of the big moves. On the same entries, trailing the whole position on the 21 EMA made 312R, against 194R for the 9 EMA. Fast trails win more often but sell the outliers early. Slow trails lose more often, but they let the few big runs pay for everything else.
Losses mostly stayed small… but not always. The average loser cost 1.06R. But thirteen trades lost more than 2R, because the stock gapped through the stop overnight. The worst was ASML at −7.4R after an earnings report, on a stop only a fraction of an ADR wide. Tight stops keep the typical loss small, but a gap is always possible, which is why your position size matters just as much as your stop.
Treat these numbers as an illustration, not a forecast. The stock list is today's index members plus names we already follow, which flatters the results, and the period was a mostly rising market. In real life your fills will also slip past the exact pivot and stop prices the test assumes.
What does carry over is the shape: lots of small losses, a few outsized winners, and a win rate well under half. If your own breakout trades don't look like that, the problem is usually your exits.
Test your own breakouts, not someone else's
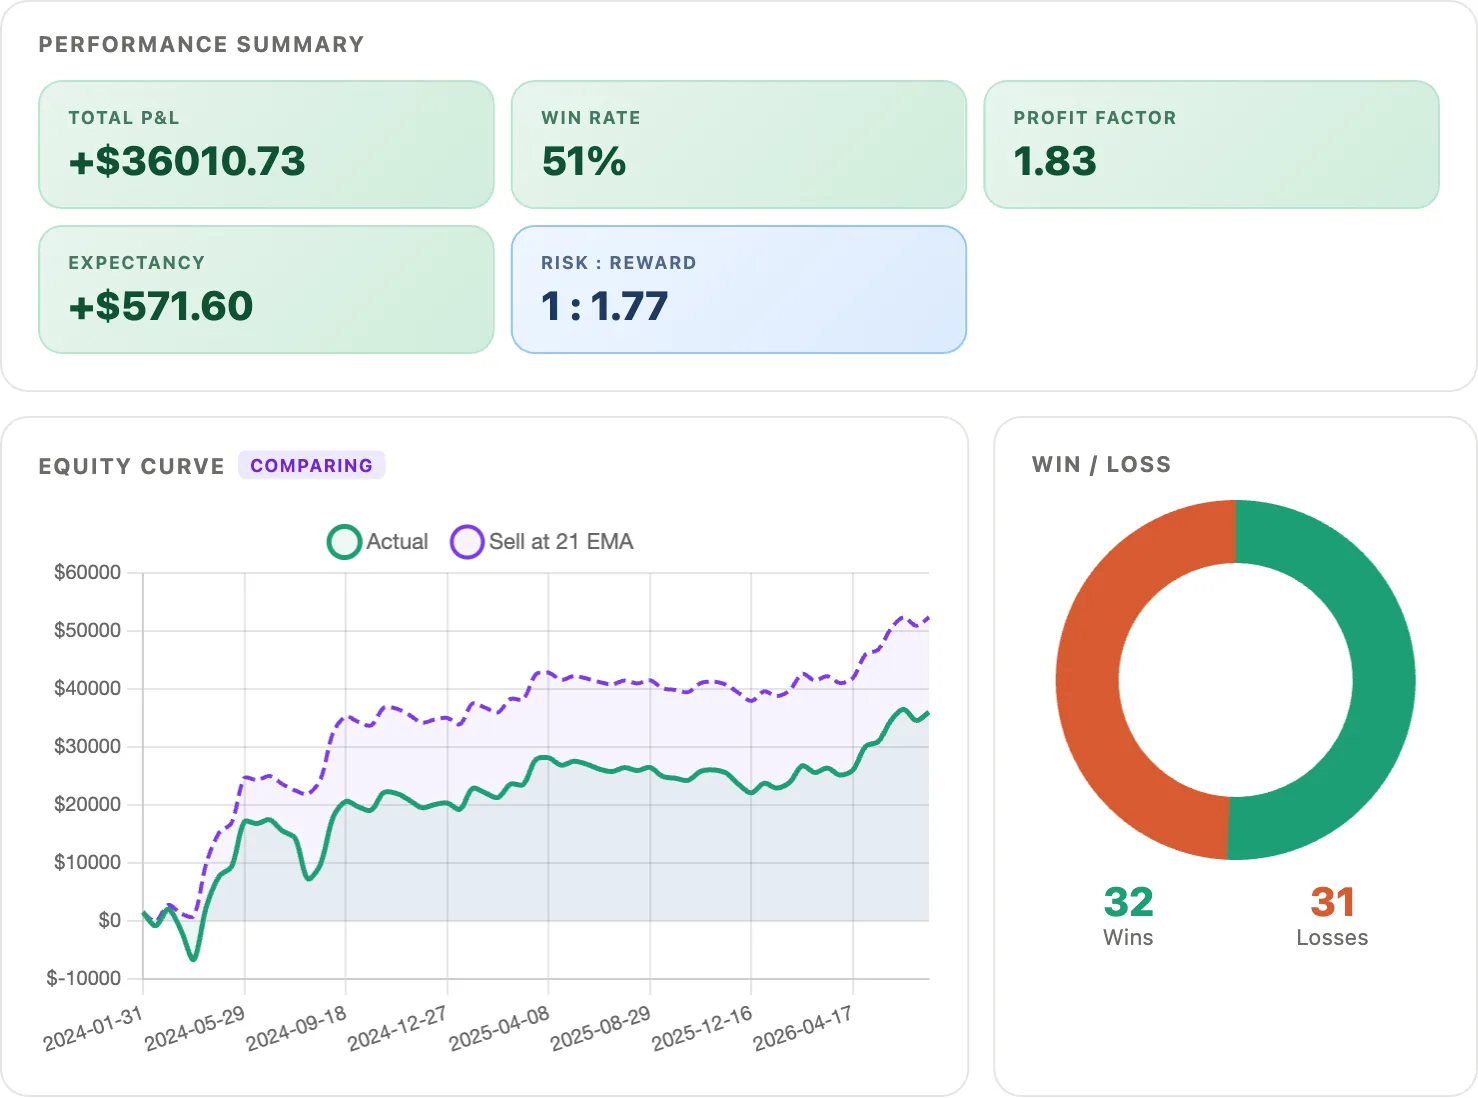
Everything above is the textbook version. What matters is how your breakout trades behave. TradePiko builds that picture automatically from your broker history:
- Every trade on its daily chart. Each breakout you take gets its own chart with your entry and exit plotted, so you can see whether you bought the range expansion or chased it.
- Simulate the exit. Split any past breakout into a day-5 partial and a runner, or enter the exit a 10-day or 20-day trail would have given (it's on the trade's auto-chart), and see which would have made you the most money. This is the step-6 question, answered with your own fills.
- MFE and MAE on every trade. See how far each breakout went for you and against you, so you can tell if your stops sit inside the stock's normal noise.
- The PIKO 50. A nightly list of the 50 highest-ranked momentum leaders, with ADR% and dollar volume on every name. This is the step-1 shortlist.
Sources and credits. The three-step breakout framework, the opening-range-high entry, the low-of-day stop and the partial-then-trail exit are described by Kristjan Kullamägi (Qullamaggie) in My 3 timeless setups that have made me tens of millions. The 544-breakout test is TradePiko's own and is illustrative, not a guarantee of future results. Some ideas are adapted from public trader interviews and notes. Educational content only.