HOW TO TRADE EPISODIC PIVOTS.
An episodic pivot (EP) is a stock that gaps up 10% or more on huge volume after a genuine surprise, usually an earnings report, at a moment when nobody was paying attention to it.
The best ones come after months of going sideways or down, with big growth and a clear beat behind the gap. And they can be the first day of a move that lasts for months.
The trade itself is simple. You buy when price takes out the opening-range high (the first 1-, 5- or 60-minute candle), put the stop at the low of the day, and trail the winners with the 10- or 20-day moving average.
The hard part is accepting how often it fails. Plenty of big gaps lose their gap-day low within a few sessions, and a handful of trades end up making most of the profit.
So losses have to stay small, because the few gaps that turn into trends pay for all of them. DELL's 2026 earnings EP, trailed on the 20-day line, made +31R on its own.
What an episodic pivot is
Most of the time, a stock's price changes slowly as opinions about it drift.
Every so often, though, something forces a sudden re-rating. It might be an earnings report far better than anyone expected, new guidance, a regulatory decision or a drug trial result. The big holders who now have to own the new story can't buy it all in one morning, so they keep buying for weeks or months.
That's the "episode", and the gap is the "pivot" from one price regime to the next.
The concept comes from Pradeep Bonde (Stockbee). Kristjan Kullamägi (Qullamaggie) made it widely known as one of his three core setups, and the rules below are mostly his.
Two ingredients make an EP work.
The first is surprise. The news has to change what the market thinks the company is worth, not confirm what it already expected.
The second is neglect. A stock that has gone sideways or down for months has been sold by the impatient and forgotten by everyone else. Nobody is sitting on a profit waiting to sell into good news, and nobody owns enough of it yet. So when the surprise lands, there's a lot of buying to do and very little supply in the way.
A stock that has already doubled into its report is the opposite case. The good news is partly priced in, and the early holders are glad to sell to the new buyers.
The catalysts
Any news that genuinely changes the picture can start an EP. The common types:
- Earnings and guidance. By far the most common, and the easiest to find and plan for, because the dates are known in advance. This is where Qullamaggie focuses.
- Biotech trials and FDA decisions. Some of the most explosive moves, but with large gap risk in both directions, so size small.
- Regulation and politics. A rule change, a contract or a policy shift that rewrites an industry's prospects.
- Macro events that hit one group of stocks especially hard or well.
The rest of this post is about earnings EPs, because they're the version most traders can run every quarter.
The checklist
A gap on its own isn't an EP. Most gaps go nowhere (more on that below). These are the conditions that separate the ones worth buying:
- A gap up of 10% or more. A big gap is the market's own verdict that the news was a surprise.
- Bonus: a gap above overhead resistance. Not required, but a big boost. When the gap clears old highs or the top of a prior range, there are no trapped buyers just overhead waiting to sell at breakeven.
- Huge early volume. Watch the pre-market and the first 5–10 minutes. The best EPs trade a full average day's volume within the first 15–30 minutes. Qullamaggie's view is that around four times normal volume is high, but on an EP you ideally want more.
- For earnings EPs: big growth and a real beat. Earnings and revenue growing strongly (ideally by high double or triple digits), and a clear beat of estimates, not a penny.
- Ideally, no big run in the prior 3–6 months. This is the neglect condition. A long flat or falling base is better than a stock that has already rallied hard into the report.
What makes some EPs more explosive
Bonde lists several extra factors that tend to make EPs move further and faster. The more of them a setup has, the better the odds:
- Sector. Health care and biotech, technology and cyclicals produce the biggest moves.
- Neglect. A long sideways base, fading volume, little news, failed breakouts and rejection at highs. All of these make traders give up on the stock.
- Low float. Fewer shares available means the same demand moves the price further.
- High short interest. A surprise forces short sellers to buy back, which adds fuel.
- Low fund ownership. If funds don't own it yet, they have a lot of buying to do.
- Analyst target raises. Several analysts (ideally three or more) raising price targets after the news.
Some context is easy for a checklist to miss.
Is the stock part of the market's current theme? Did its past EPs follow through, or fade? (Stocks tend to repeat their behaviour.) And where is the market in its cycle? Early in an advance, good reports get rewarded. Late in one, even good reports can gap down, because the good news was already expected.
The entry, the stop and the size
The trigger is price taking out the high of the first 1-, 5- or 60-minute candle. Shorter candles get you in earlier with a tighter stop, while longer ones filter out more false starts. (See opening range high entries for the trade-offs.)
A stock may break below its opening range first and still trigger later. What matters is that buyers take control.
The stop goes at the low of the day, and there's always a stop.
Gap days are much wider than normal days, so EP stops measured from the low of day are often wider than the average daily range (ADR) measured before the gap. You handle that with the position size, not by moving the stop. The share count is the dollar risk divided by the distance from entry to the low of day, whatever that distance turns out to be.
There's also a second way in: the delayed entry, which Bonde teaches. You don't have to buy the gap day at all. Put the stock on your watchlist and wait for it to set up a low-risk spot in the days or week after. Usually that's a tight, quiet range near the highs as volume dries up, or a pullback that holds above the gap-day low. The entry is the break out of that range, and the stop goes under it. The stop is much tighter than a low-of-day stop on the gap day, so you can size up for the same dollar risk. It's also how you get into an EP you missed.
Size also has a ceiling, set by liquidity. Qullamaggie's rule of thumb is not to trade more than about 1% of a stock's average daily volume, or the slippage on a fast-moving gap gets bad. That matters most on the small, thinly traded names, which is where EPs tend to be most explosive.
Managing the trade
Once the trade is past the danger of the first few days, you manage the EP like a breakout. Hold while the trend holds, and exit on the first close below a moving average. The 10-day line suits fast moves. The 20-day (or even the 20/50-day) gives a real trend room to run.
Neither choice is "right". The 10-day protects you on the many EPs that run for two weeks and stop. The 20-day is what catches the rare one that becomes a multi-month trend. Our post on the 10-day versus the 20-day moving average goes further into choosing.
Two refinements suit particular kinds of EP. Small, high-ADR names often trade sloppily after the first burst, so it can pay to trim into the initial explosion rather than wait for a trail. And for biotech, Bonde describes a two-stage move: take the first one- or two-day pop, then look to trade the slower drift or the breakout that can follow weeks later.
Why most gaps fail
Most of the reasons are visible on the day, or before it:
- The news wasn't really a surprise. A small beat on a stock that already ran into the report gets sold.
- The volume isn't there. A gap on modest volume shows that the big buyers aren't involved yet.
- Weak growth behind the beat. A beat made of cost cuts, with flat revenue, rarely starts a trend.
- The stock's own history. If its past EPs faded, the next one probably will too. A stock that only breaks out between reports is a red flag for this setup.
- The market. Gaps follow through in healthy markets and get sold in weak ones. Late in a cycle, even very good reports gap down.
Qullamaggie is open that EPs often fail, and that the winners more than make up for it. But that only works if every loss is cut at the low of the day.
A gap that fills and closes below its opening range is information. Take the small loss and look at the next one.
A guidance raise after six flat months: SMCI in January 2024
Super Micro (SMCI) had a huge 2023, then spent the next six months going nowhere, up just 3% from August to January. Then it put out preliminary results and raised its quarterly guidance well above what anyone expected. The stock gapped up 11.6% the next morning on 7.1 times its average volume.

The second hour took out the first hour's high, and the stop went at the low of the day. That low was almost three times SMCI's normal daily range away, so the position had to be small. It never came close again. At its peak, two months later, the stock had tripled from the entry. The 10-day trail made +5.0R while the 20-day held on into March for +7.7R.
A contract win after a 71% slide: ASTS in May 2024
AST SpaceMobile (ASTS) had fallen 71% from its December high by early April, and then sat in a quiet, low-volume base. Then it signed a definitive commercial agreement with AT&T, announced with its quarterly results. That turned a long-promised partnership into a contract, and the stock gapped up 31.4% on more than 30 times its average volume.

The entry came in the second hour on the break of the first hour's high, with the stop at the low of the day. A second gap two weeks later added fuel. The 10-day trail was out in June at +13.3R. The 20-day trail stayed in until September, by which time the stock had risen about eightfold from the entry, for +50.8R.
An election surprise: COIN in November 2024
Not every EP starts with earnings. Coinbase (COIN) slid 46% from July to September and was still down 8% over six months going into the US election. The result was read as much friendlier for crypto regulation, a political catalyst that rewrote the outlook for the whole industry. COIN gapped up 14.2% on about three times its average volume, lighter than the best EPs, behind a catalyst that was hard to miss.

The second hour broke the first hour's high, and the stop at the low of the day was only about 5% away. The stock closed near its high that day and kept going. The 10-day trail banked +5.2R late in November, and the 20-day trail sold in December for +6.5R, a 33% move.
A blowout quarter after a crash: LEU in May 2025
Centrus Energy (LEU), a uranium enrichment company, fell 60% from its February high to the April market low and was down 7% over six months. Then its first-quarter report showed revenue in its main uranium segment more than doubling, and a profit where a year earlier there had been a loss. The stock gapped up 11.4% on 4.1 times its average volume.

LEU took longer to trigger. The first hour's high didn't break until the third hour, and the stop went at the low of the day. The stock then went sideways for about two weeks, and the 10-day trail got out with just +0.9R. The 20-day trail sat through that pause and rode the trend into the end of July, a 147% move, for +18.7R.
A beat after a 69% slide: CRCL in February 2026
Circle (CRCL) had fallen 69% from its October high by early February, and was down 51% over six months. Then its fourth-quarter report showed revenue up 77% from a year earlier, USDC in circulation up 72%, and earnings well ahead of estimates. The stock gapped up 20.2% on 5.4 times its average volume.

The second hour broke the first hour's high, and the stop at the low of the day was about 6% away. The stock ran for a month, then dropped hard in one day and closed below both moving averages at once, so the 10-day and 20-day trails exited together for +5.2R, a 33% move.
The textbook shape: DELL in February 2026
DELL slid 34% in late 2025, then went quiet in a long sideways base, down 8% over the six months before its report. Then came the surprise: fourth-quarter revenue up 39%, an earnings beat, AI server revenue up 342%, and guidance well above consensus. The stock gapped up 13.1% on 4.2 times its average volume, and it traded more shares in its first hour than on a normal full day.

The second hour pushed through the first hour's high, and the stop went at the low of the day, 5.6% away and never touched again. The first days were uncomfortable, with DELL drifting sideways near the stop. Then the trend started. The 10-day trail made +2.5R when DELL paused in late March, and the 20-day trail rode four months of trend for +31.3R. That's the trade-off from the management section in one chart.
It takes several earnings seasons to get good
EPs come in clusters, four times a year. You might see a dozen good candidates in a busy week, and then almost nothing for the following two months.
That makes the learning slow. Qullamaggie reckons it takes four to eight earnings seasons, or one to two years, to get good at judging which gaps are real. Most of that skill is pattern recognition, so the best use of the quiet weeks is studying past EPs: the ones that worked, the ones that failed, and what the two looked like on day one.
His own study method is a scan for liquid stocks that rose 50% or more within 14 days at any point in the past six months, then a look at every chart it returns. One run of his gave 444. His advice is not to take his word that EPs are good trades, but to check them yourself across hundreds of examples.
The setup does suit people with jobs. Most of the work happens in the 30 minutes before the open and the first 30 minutes after it, when you see the gap, check the news and the volume, and set the buy-stop above the opening range.
Build your own EP playbook
EP skill comes from seeing many gaps, and from being honest about how your own gap trades behave. TradePiko builds that record from your broker history:
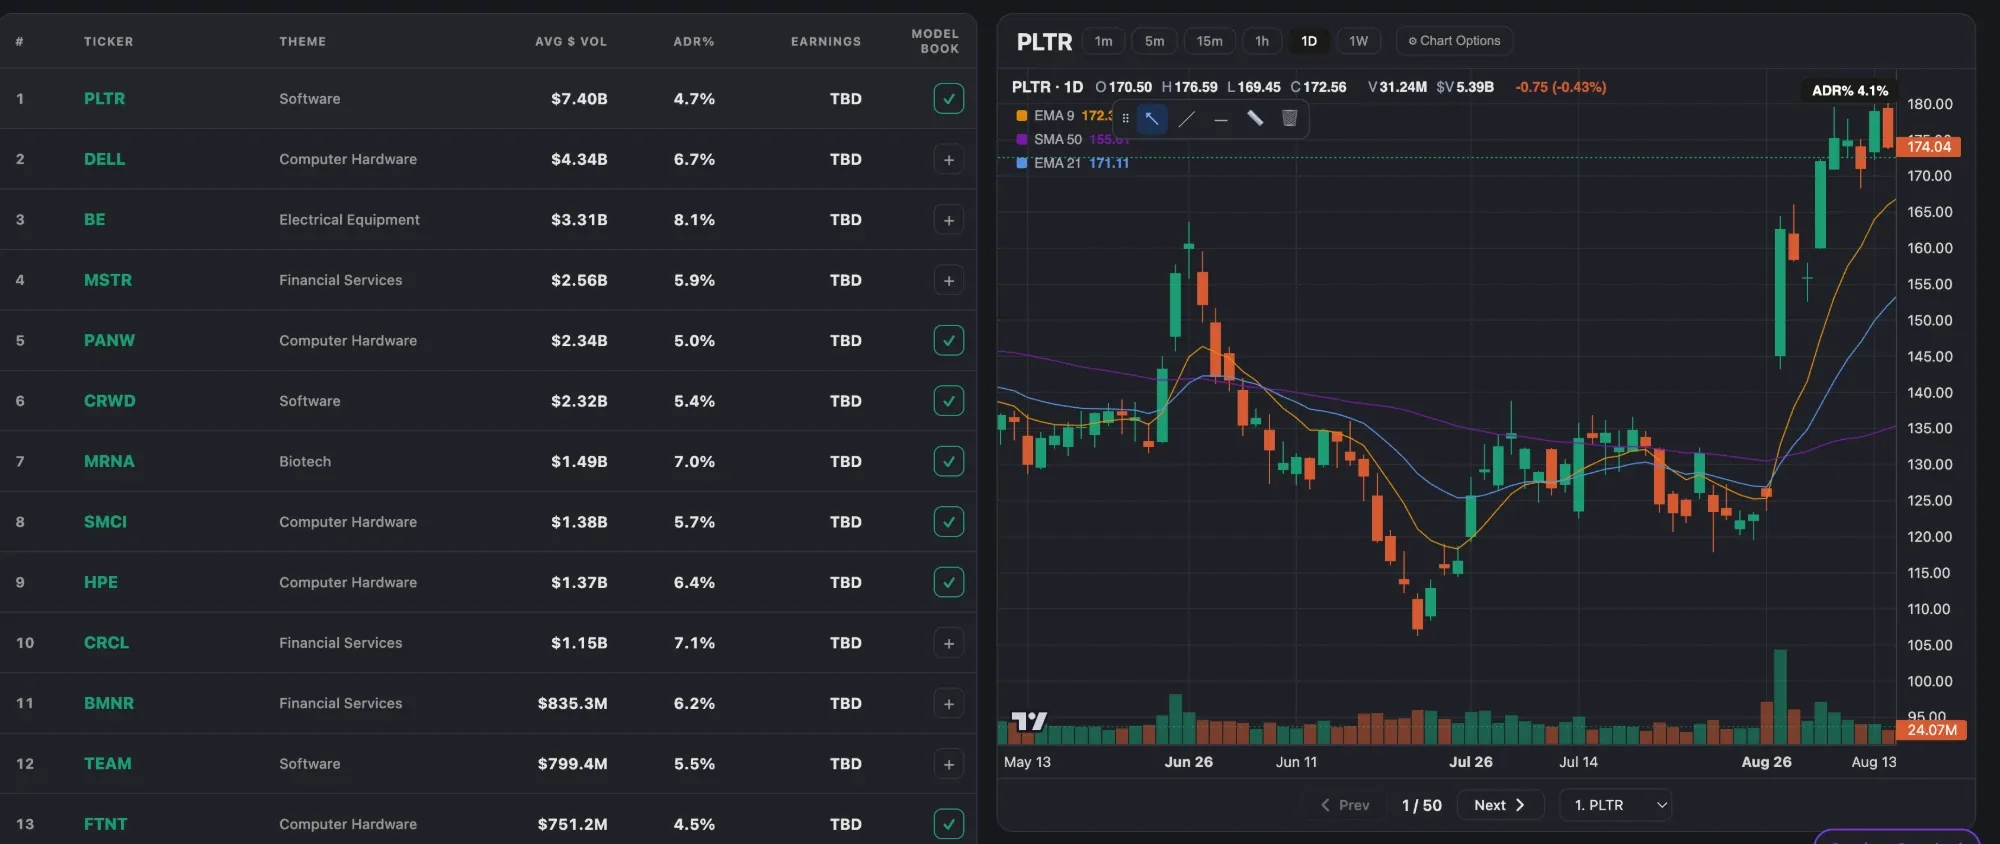
- Earnings dates on the PIKO 50. The nightly list of the top-50 momentum leaders shows each name's next earnings date, ADR% and dollar volume, so you know which reports to watch before the gap happens.
- Every trade on its daily chart. Each EP you take is charted with your entry and exit, so you can see whether you bought the opening-range high or chased the open.
- Simulate the trail. Each trade's auto-chart shows where it first closed below the 10-day or 20-day line. Enter that exit on the trade in Trade Simulation, and TradePiko recalculates total P&L, win rate and expectancy against what you actually did, with both equity curves on one chart.
- Model Books and setup tags. Save the charts of EPs that worked and failed into a book, and tag your trades as EPs so their stats are separate from your breakouts.
Sources and credits. The episodic pivot concept and the explosiveness factors (sector, neglect, float, short interest, fund ownership, analyst raises) are Pradeep Bonde's (Stockbee). The checklist, the opening-range-high entry, the low-of-day stop, the 10/20-day trail and the four-to-eight-seasons estimate are described by Kristjan Kullamägi (Qullamaggie) in My 3 timeless setups that have made me tens of millions and his streams. So are the four-times-volume threshold, the 1%-of-volume liquidity rule and the 50%-in-14-days study scan. The biotech two-stage move is Bonde's. Some ideas are adapted from public trader interviews and notes. The six worked trades (SMCI, ASTS, COIN, LEU, CRCL and DELL) are replayed by TradePiko from daily and 60-minute bars. The catalysts and quarterly figures behind them are as reported in the companies' releases and financial press coverage at the time. These examples are illustrative, not a guarantee of future results. Educational content only.