WHAT MOVING AVERAGE SHOULD I USE?
Once a breakout has worked, the shares you still hold need an exit with no target. The usual answer is a moving average: hold while the stock stays above the line, and sell on the first close below it.
The 10-day and the 20-day are the two common choices. The 10-day hugs price and gets you out sooner. The 20-day gives the stock room to rest, and hands back more when the move ends.
Neither one is right on every trade, so the real job is picking the line that suits the stock and the way you trade, and then sticking with it.
What a trailing moving average is for
Once a breakout has worked and you've sold a piece, the rest of the position needs an exit that has no target. A trailing moving average does that job.
You hold while the stock stays above the line, and sell on the first daily close below it. The line rises with the stock, so your exit rises too, and you never have to guess where the move will end.
The trade-off is simple. A short average hugs price, so you give back less from the high, but you get shaken out of trends that pause. A long average gives the stock room to rest, so you ride longer trends, but you hand back more when the move finally ends. Every trailing average sits somewhere on that line. The question is where.
The 10- and 20-day lines are the usual choices for breakout trades. Qullamaggie trails with the 10-day on fast stocks and the 20-day on slower ones. He acts only on the close, and starts trailing once the line has caught up with the original stop.
Another common approach uses the 10 EMA for the first burst and the 21 EMA for multi-week trends, with a simple rule of thumb: a stock above a rising 10 EMA is doing nothing wrong. Some traders use the 9 EMA instead, and some use the 10-day almost exclusively while trailing a small slice on the 20-day to ride winners further.
Fast stocks and slow stocks
The usual advice is to match the line to the stock: the 10-day for fast movers, the 20-day for slower ones.
The reasoning is about distance. On a stock with a large average daily range, the 20-day line sits far below the price, so a lot of profit goes back before it breaks. On a steady stock the two lines sit close together. The 10-day breaks on ordinary pauses, and the 20-day's extra room costs little.
The ADR is the quickest way to tell which kind of stock you're holding. A stock that moves 6 or 7% a day can fall from its 10-day to its 20-day in a session or two, as RGTI and IREN did below. A stock that moves 2 or 3% a day often drifts sideways along its 10-day for weeks without going anywhere.
It's a rule of thumb, though, not a law. Fast stocks sometimes rest and then run again, and that's exactly when the 20-day pays. The MRVL example below is one of those.
The market matters as well as the stock. Some traders shorten their holds in choppy markets, going from weeks on the 10-, 20- and 50-day lines to one to three days on a 5-day average. When trends are short, a slow trail mostly measures how much you give back.
Close below, or intraday touch?
Qullamaggie's rule is to act on the close, not on an intraday break. Stocks often undercut the line during the day and recover by the close, and those undercuts are often what shakes traders out of good positions. If a close below the line is clear, he sells in the last few minutes of the session.
The close rule has another advantage. You only have to look once a day, 10–15 minutes before the close.
A touch rule means watching the screen, or leaving stop orders that get hit on every quick dip below the line. If you can't watch the close, there's a workaround: treat the 10-day as a mental stop, and after a close below it, use the next day's five-minute opening-range low as the actual stop.
Simple or exponential?
An exponential average weights recent prices more heavily, so it turns faster than a simple one of the same length. Some traders prefer EMAs for that reason.
In practice a 10 EMA sits a little closer to price than a 10-day simple average, and a 21 EMA a little closer than a 20-day, so the exponential version tends to get you out slightly sooner. That gap is small next to the gap between a 10 and a 20 of either kind. Speed matters far more than the formula.
Consistency beats the exact number
What does cost money is mixing them up.
The expensive version is the trader who switches to the 20-day after a run of 10-day whipsaws, and then switches back after the 20-day gives back a big winner. That trader gets the costs of both lines and the benefits of neither.
The other trap is choosing a line from one chart. You can always find a trade where the 10-day was right, and another where the 20-day was. The five examples below show both, which is the point. A trail can only be judged across many trades.
Five breakouts, two trailing lines
Each of these is a breakout from a base (the setup in how to trade breakouts), handled with the same plan. The entry came as price cleared the top of the base, the stop went under the low of the day, a third was sold at the close of the third day, and the stop on the rest moved to break-even.
Then the rest was trailed two ways, once on the 10-day and once on the 20-day, selling on the first close below the line. Only that last step differs, so each chart shows what the choice of line was worth on one real trade.
A fast stock where the 10-day kept more: RGTI, September 2025
Rigetti Computing (RGTI) is the kind of stock the 10-day is built for. It moved about 7% a day, and it broke out of a three-week base on heavy volume and more than tripled from the entry in about a month.

The top came fast. Three sessions after the high, RGTI closed below its 10-day and the rest was sold there. The 20-day line was still far below, and by the time the stock closed under it two sessions later, it had given back almost a third from the high. The 10-day trade made +35.4R, against +28.2R on the 20-day.
The 10-day sold closer to the top: IREN, June 2025
IREN moved about 6.5% a day. It gapped above a three-week base and nearly doubled in four weeks, with a long spike high near the top that faded the same day.

After the spike the stock went sideways and then slipped under the 10-day, which sold the rest. The 20-day exit came just one session later, but about 6% lower, because a fast stock covers a lot of ground in a day. The 10-day trade made +22.7R, against +19.5R on the 20-day. (IREN climbed back above both lines in August, which neither trail could have known.)
A slow stock where the 20-day kept you in: TEL, May 2025
TE Connectivity (TEL) is the opposite case. It moved under 3% a day, and after its breakout from a two-and-a-half-week base it climbed in small steps, resting along its 10-day for weeks at a time.

The first pause was enough to close it below the 10-day, barely a week and a half after the entry, so the 10-day trade ended there. The 20-day sat a little lower and never broke on a close, through a slow summer climb and a jump in late July, until the stock finally rolled over in August. The 10-day made +3.3R, and the 20-day made +19.6R.
The 20-day rode the second leg: HUM, May 2026
Humana (HUM) moved about 4% a day, steadier than the momentum names. It broke out of a two-week base and ran 21% in three days, so the third sold on day 3 was already a big win.

Then it rested flat for two weeks while the 10-day caught up, and one quiet close below the line ended the 10-day trade. The 20-day was still well below. HUM started its second leg a few days later and kept going for six more weeks, until a day that made a new high and then reversed to close under the 20-day. The 10-day made +11.9R, and the 20-day made +25.1R.
A fast stock where the 20-day won anyway: MRVL, April 2026
Marvell (MRVL) is the exception to the rule of thumb. It moved about 5.6% a day, a fast stock by any measure, and it gapped above a four-week base with a tight stop and ran almost 60% before its first close below the 10-day.

That close ended the 10-day trade at +22.4R, a fine result. But the 20-day line was still well below, so the rest stayed on. MRVL rested, broke out again and more than tripled from the entry by June, and the first close below the 20-day came near the end of that month, for +60.0R.
The 10-day wasn't wrong here. It did exactly what it's built to do, which is get out when a stock stops trending. A close under the 10-day after a 60% run is a common way for a trend to pause, and the 10-day can't tell a pause from an ending. On the day it broke, nobody could have known which kind of trade this was.
How to choose yours
Put the examples side by side and a pattern shows up. On the fast stocks that topped sharply, the 10-day sold closer to the high. On the steadier stocks that rested and then ran again, the 20-day kept you in for the next leg. And sometimes, like MRVL, a fast stock rests and runs again too.
So a simple way to set yours up looks like this:
- Pick a line for fast stocks and one for slow stocks. The 10-day for high-ADR names and the 20-day for steadier ones is the classic split. If you'd rather not judge each stock, trail half on each.
- Act on the close. Decide in advance that a close below the line is the exit, not an intraday dip, and check it near the end of the session.
- Decide when the trail takes over. Sell a piece first and move the stop to break-even, or start trailing once the line has caught up with your original stop.
- Write it down and use it on every trade. Switching lines after a bad run is the expensive mistake.
Then judge it on your own trades over a large sample, not on the last chart that hurt. You can do that by backtesting an exit rule on trades you already took. For the full set of exit options, including how much to sell before the trail takes over, see swing trading selling techniques.
Find out which line fits your trades
The charts above are other people's stocks. Your own trades will give the answer that counts, and TradePiko gets it from your broker history:
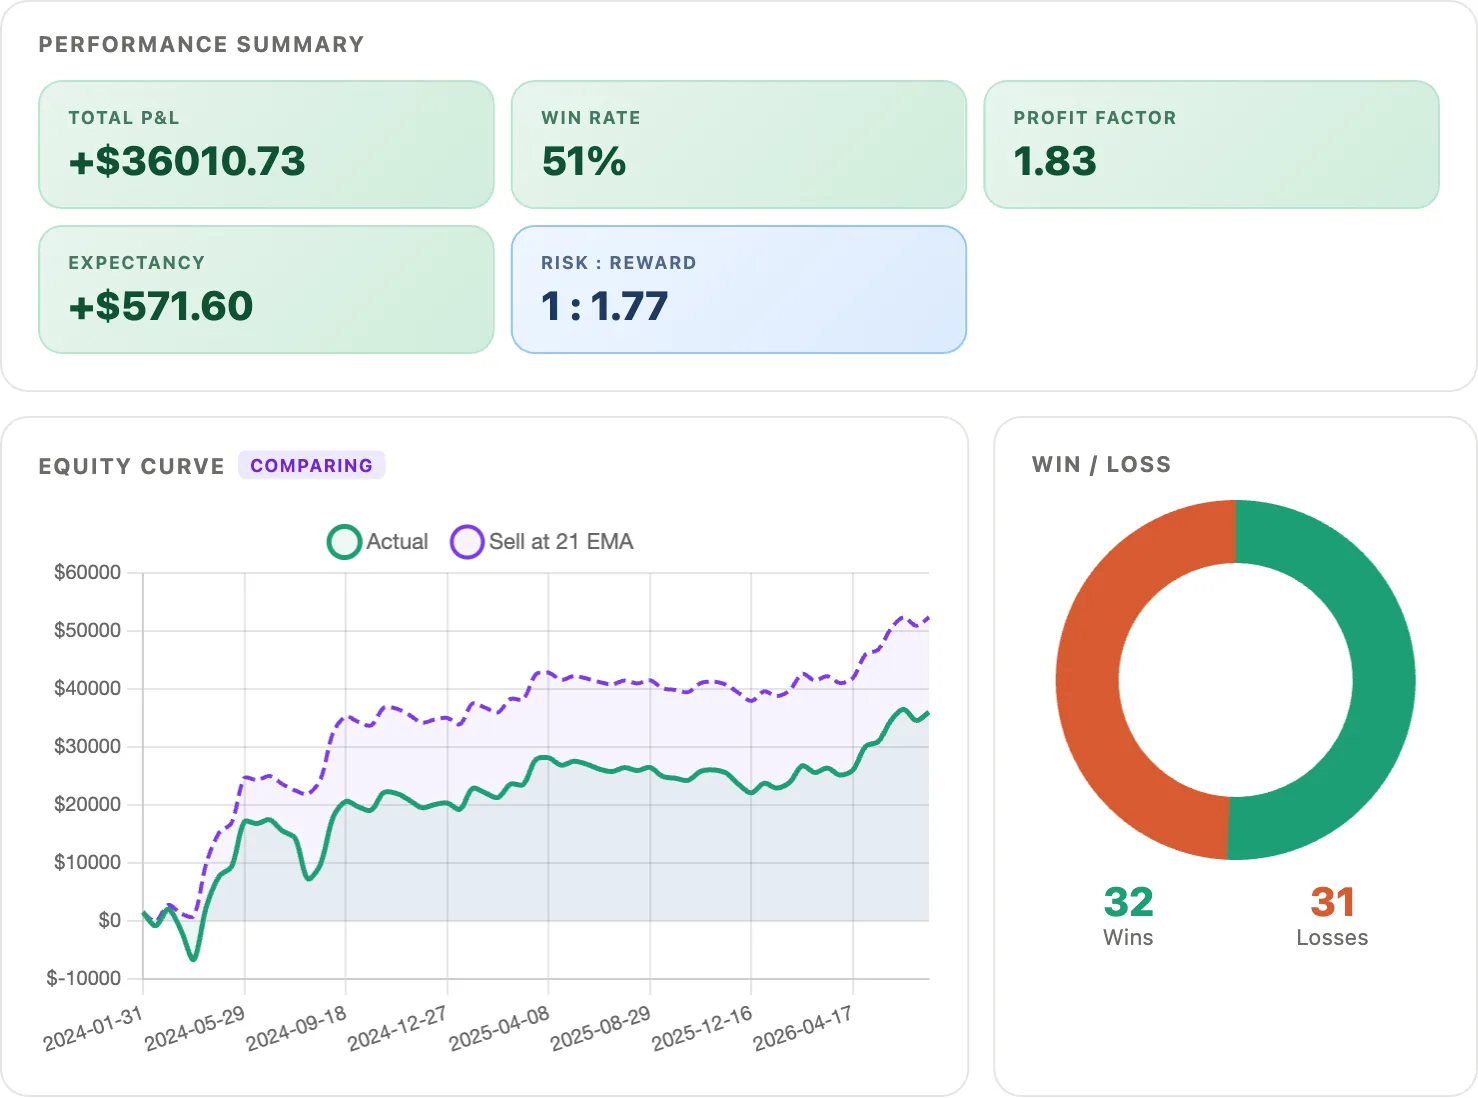
- Simulate the trail. Each trade's auto-chart shows where it first closed below the 10-day or 20-day line. Enter that exit on the trade in Trade Simulation, and TradePiko recalculates total P&L, win rate and expectancy against what you actually did, with both equity curves on one chart.
- Every trade on its daily chart. See where each exit happened against the moving averages, and spot the undercuts that shook you out.
- MFE and MAE per trade. Measure how much of each move you kept, and how much went back before your trail fired.
- The PIKO 50 with ADR%. Every leader on the nightly list shows its ADR, so you know how fast a stock moves before you choose how loosely to trail it.
Sources and credits. Trailing breakouts with the 10- and 20-day moving averages, acting on the close rather than intraday breaks, and matching the line to the stock's speed are Kristjan Kullamägi's (Qullamaggie) rules, from his Chat With Traders interview. The five example trades are drawn from real daily prices with one fixed plan (a breakout entry, a stop under the low of the day, a third sold at the day-3 close, the rest trailed on a close below the 10- or 20-day). They were picked as clear winners to show the idea, and they are illustrative, not a guarantee of future results. Some ideas are adapted from public trader interviews and notes. Educational content only.