DRAWDOWNS AND LOSING STREAKS.
Every strategy with an edge still loses money for long stretches.
So the question isn't whether a drawdown will come. It's how deep it'll go, and whether you'll still be following your rules when it does.
Drawdowns hurt more than they look, because a 50% loss needs a 100% gain to recover. And long losing streaks aren't rare either. At a 30% win rate, a run of ten losses in a row is more likely than not over 100 trades (58%).
And a drawdown is usually deeper than the longest streak, because the small losses between small wins add to it. The one thing that scales it almost one for one is your risk per trade. Halve the risk and the drawdown roughly halves.
That means your defence gets decided before the streak starts. You choose a risk per trade that keeps a realistic bad streak survivable, and you add a monthly loss cap so a bad market can't turn into a bad year.
The recovery maths
A loss and the gain you need to undo it aren't the same size, because the gain is earned on a smaller account. The required gain is loss ÷ (1 − loss).
| Drawdown | Gain needed to get back to even |
|---|---|
| −10% | +11.1% |
| −20% | +25.0% |
| −25% | +33.3% |
| −30% | +42.9% |
| −40% | +66.7% |
| −50% | +100.0% |
| −75% | +300.0% |
A 50% drawdown doesn't just cost you half the account. It also costs you the time it takes to double what's left, and that happens at the moment your confidence is lowest.
How likely is a long losing streak?
With a low win rate, long losing streaks aren't bad luck. They're close to certain.
Here's the exact probability of at least one streak of a given length somewhere in 100 trades, treating every trade as independent:
| Streak of at least… | 20% win rate | 30% win rate | 40% win rate | 50% win rate |
|---|---|---|---|---|
| 5 losses | over 99.9% | 99.9% | 97.6% | 81.0% |
| 6 losses | over 99.9% | 99.0% | 87.3% | 54.6% |
| 8 losses | 99.3% | 85.8% | 49.0% | 17.0% |
| 10 losses | 93.4% | 58.0% | 20.5% | 4.4% |
| 12 losses | 78.9% | 32.9% | 7.7% | 1.1% |
| 15 losses | 50.8% | 12.1% | 1.6% | 0.1% |
| 18 losses | 28.4% | 4.1% | 0.3% | under 0.1% |
| Average longest streak | 15.6 | 10.7 | 7.9 | 6.0 |
The traders this blog draws on treat all this as normal. Qullamaggie's view is that you spend most of your time in drawdown, even in a great year, and that win rates of 25–35% are ordinary for this style of trading.
Marios Stamatoudis makes a related point: you need to know what normal looks like for your own strategy. If you know a ten-loss run is expected, you can sit through it. If you don't, it feels like the edge has gone.
Rule 1: size so the streak is survivable
Start from the streak, not from the trade. A run of losses at a fixed percentage risk costs 1 − (1 − risk)N of the account:
| Losses in a row | 0.25% risk | 0.5% risk | 1% risk | 2% risk |
|---|---|---|---|---|
| 10 | −2.5% | −4.9% | −9.6% | −18.3% |
| 15 | −3.7% | −7.2% | −14.0% | −26.1% |
| 18 | −4.4% | −8.6% | −16.5% | −30.5% |
Full −1R losses, compounded. The losses between small wins come on top of this, which is why real drawdowns run deeper (more on that further down).
Risk per trade is the one lever that scales drawdown almost one for one. Your win rate and your R profile are set by the strategy and the market, but the percentage you put at risk is set by you. A good rule of thumb: if your win rate is below 40%, controlling losses should be your main focus.
The other half of the rule is to never raise risk to win back a drawdown.
The table above shows why. Eighteen losses in a row cost 4.4% of the account at 0.25% risk, but 30.5% at 2%. So stepping up your size mid-streak is exactly how a manageable drawdown turns into a deep one.
Do the opposite, and trade smallest when you're trading worst. That's Mark Minervini's progressive exposure, which is covered in progressive exposure position sizing.
Rule 2: cap the month, not just the trade
A per-trade stop limits one loss. It does nothing about twenty of them in a hostile market.
Big losing months are what damage compounding, and one answer is a monthly loss cap of 5% of equity. It builds on Mark Minervini's loss-adjustment exercise, where you re-run your history as if every loss had been capped and see what the cap would have saved.
At 1% risk, a 5% monthly cap is about five full losses (five losses cost 4.9%). At 0.5% risk, it's about ten. When you hit the cap, you stop opening new trades until the next month.
If trades really were independent coin flips, this rule would rarely matter. But in real markets losses cluster, and that's exactly when a cap earns its keep.
It pairs naturally with a smaller daily limit on new positions. Together they turn "I'll stop when it feels bad" into rules you set before the streak starts, which is the only time you can set them calmly.
How deep does the drawdown get?
A streak table only counts losses in a row. Real drawdowns also include the losses between small wins.
So it helps to think in R first and convert to a percentage afterwards. Picture a rough stretch at a 30% win rate: a 15-loss run (about a one-in-eight chance over 100 trades, from the table above), with a few small winners and a few more losers either side of it. Add it up and a fall of around 30R from peak to trough isn't hard to reach.
Here's what 30R costs at different risk levels, compounded:
- 1% risk: about 26% of the account.
- 0.5% risk: about 14%.
- 0.25% risk: about 7%.
Two things follow from that.
A 10% drawdown is normal. At 1% risk, ten full losses in a row are enough to get there, and at a 30% win rate a ten-loss run is more likely than not over 100 trades. It doesn't mean the edge is gone.
Risk per trade scales the drawdown almost one for one. Going from 1% to 0.5% roughly halves it. Your win rate and the market decide how many R you lose in a bad patch, but you decide what each R costs.
The 30R figure is an illustration, not a forecast. And because real losses cluster, a bad market can push a drawdown deeper than any coin-flip sum suggests. (See why market environment matters more than your setup.)
Choosing your own risk per trade
Here's a practical way to choose your number:
- Decide the largest drawdown you could sit through without changing your rules. Be honest with yourself. For many people it's 10–15%.
- Estimate a bad-case drawdown in R for a strategy like yours. For one that wins about 30% of the time, the 30R from above is a sensible start: about 26% of the account at 1% risk, 14% at 0.5% and 7% at 0.25%.
- Pick the largest risk per trade where that number still sits inside your limit. For a 15% limit, that's about 0.5%, in the middle of the 0.25–1% range Qullamaggie describes. It's lower than most people expect, and that's the point of doing the sum.
- Never raise risk to win back a drawdown. Step your size down after a losing run, as in Rule 1, and set your monthly cap from Rule 2 at the same time.
Know your drawdown before it happens
The numbers above are round illustrations. Your own streaks and drawdowns depend on your win rate and your R profile, and TradePiko measures both from your broker history:
- Current drawdown and longest losing streak. See how far you are from your equity peak and how long your worst run of losses has been, next to your win rate and expectancy.
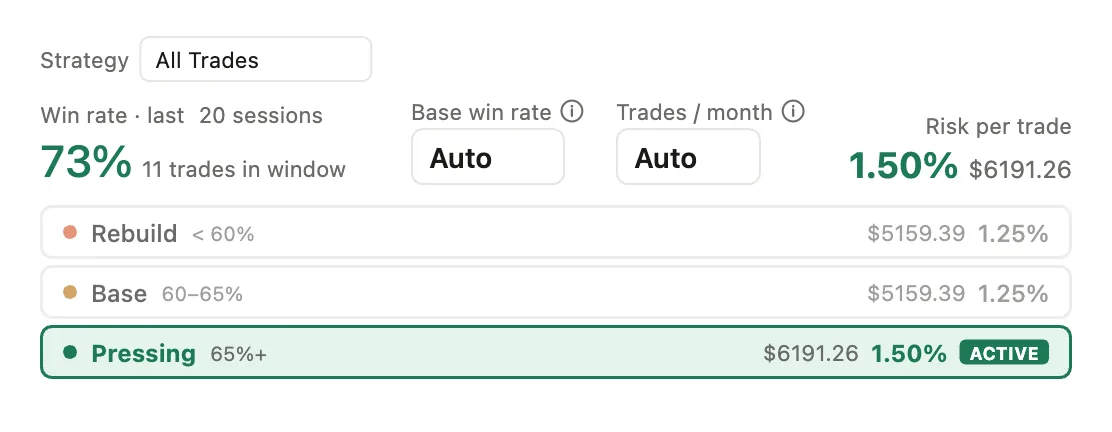
- Position Sizing Advisor. Suggests risk per trade from your recent win rate, so size steps down when you are in a rough patch and back up when you are trading well.
- P&L Calendar. Spot the losing months and the days you opened too many trades.
- Trade Simulation. Re-run your history at a different size, or exclude the trades from your worst bursts, and compare the result with what actually happened.
Sources and credits. The loss-adjustment exercise and progressive exposure are Mark Minervini's. Qullamaggie's risk range is as he describes it, and so is his point that most of your time is spent in drawdown. Knowing what normal looks like for your strategy is Marios Stamatoudis's idea. The streak probabilities are exact calculations. The 30R drawdown is a round-number illustration, not a forecast or a guarantee of future results. Some ideas are adapted from public trader interviews and notes. Educational content only.