RELATIVE STRENGTH: FIND THE LEADERS BEFORE THEY RUN.
Relative strength (RS) is how a stock is doing compared with the market, not how far it has gone up.
It's the quickest way to find the stocks big buyers are holding on to while they sell everything else, and those are usually the stocks that lead the next move.
You can see it on an RS line, which is just the stock's price divided by SPY. When that line makes a new high before the price does (often during a market pullback), the stock is already near the top of the market, even if its own chart hasn't shown it yet. And the leaders are rarely hiding. William O'Neil found that the biggest winners were already beating about 87% of stocks before their runs.
So the practical method is simple. Scan for the top 1–2% of stocks by performance over one, three and six months, and only look for setups in that group.
Relative strength is not the same as going up
Absolute strength is a stock going up. Relative strength is a stock doing better than the market around it.
In a bull market the two usually overlap, which is why people mix them up. But they come apart at exactly the moments that matter most.
Say a stock rises 10% while the Nasdaq rises 20%. It has absolute strength but relative weakness, because the money is going somewhere else. Now say a stock falls 5% while the index falls 15%. It has no absolute strength at all, but it's one of the strongest stocks in the market. When the selling pressure lifts, that stock usually has fewer trapped buyers above it and more patient ones underneath.
Leaders matter so much because a small number of stocks do almost all the work. Hendrik Bessembinder's study found that about 4% of US stocks produced all of the stock market's net gains from 1926 to 2016. And William O'Neil's research into the biggest winners found that, before their major moves, they were already outperforming roughly 87% of the market.
The leaders are rarely hiding. They're usually already near the top of the performance tables.
Leadership also tends to stick around. Qullamaggie's observation is that the stocks that have made the biggest moves tend to keep making the biggest moves, as long as they're real companies with real earnings rather than pumps. That's why a momentum trader starts from the strongest stocks, not the cheapest.
The RS line
The simplest RS tool is a line. Each day, divide the stock's closing price by SPY's closing price and plot the result.
The level means nothing. Only the direction matters. A rising line means the stock is beating the market, and a falling line means it's lagging, even if the price is going up.
The most useful signal is the RS line making a new high before the price does. It tells you the stock is near the top of its range relative to everything else, before that shows up on its own chart.
You see it most clearly in a market pullback. The index sinks, the stock moves sideways or dips only a little, and the line climbs. A chart scan that only looks at price highs flags those stocks later.
The tennis ball test, and what it really measures
Qullamaggie describes corrections as a test that shows you the leaders. Push the market under water and most stocks sink. The few that hold up are like a tennis ball held under the surface: let go, and they shoot up first.
It's easy to read that as "buy the stocks that fell least", and that naive version doesn't hold up well. Fast, high-ADR leaders fall hard in a sell-off and snap back hard, so the size of the drop is a poor guide on its own. "Holding up" is better read as keeping the long-term trend intact while the index breaks its own.
So in a correction, judge strength by structure and by the RS line, not by the size of the drop. Is the stock holding above its 50- or 200-day line while the index is below its own? Is its RS line near its highs? Those are better questions than whether it fell less.
The type of stock that's leading matters too. Leadership within a cycle often moves in a sequence: fundamental leaders first, then growth names, then speculative ones. When the speculative names are running while the original leaders weaken, the cycle is usually late.
Scanning for relative strength
Qullamaggie's version is blunt. Scan for the top 1–2% of stocks by performance over the last one, three and six months, keep the liquid ones, and only then look at charts. For a momentum trader, everything else is noise.
A looser version takes the top 20% by RS, with an RS line that has been rising for 8–13 weeks or is running ahead of price.
A workable weekly routine looks like this:
- Rank on several look-back periods. One month finds new leaders, six months finds established ones, and three months balances the two. A stock near the top of all three is the one to study first.
- Filter for tradability. You want enough average dollar volume to get in and out cleanly, and enough average daily range (ADR) for the move to be worth the risk. Breakout traders often want 4–5% ADR or more.
- Check the RS line. Is it at or near a new high? Did it go up during the last market dip?
- Check the trend structure. Sort your lists by how the 9-, 21- and 50-day exponential averages are stacked. 9 above 21 above 50 is a leader, the reverse is a laggard, and anything mixed is mediocre.
- Look for clusters. When several names from one group move up the list together, it usually means a theme, and that's an early sign of where the next leaders will come from.
- Only then look for a setup. RS tells you which stocks. A base and a trigger tell you when. See how to trade breakouts for the setup itself.
The RS line leading: PLTR in 2025
PLTR in 2025 is a clean example.
It closed at a high of 124.62 on February 18, the day before the S&P 500 started a 19% correction. At first PLTR fell harder than the market, down to a close of 74.01 on April 4. But its RS line turned up first.
On April 25 the line climbed back above its February high. That day PLTR's price was 112.78, still 9.5% below its own high. SPY was 10.2% below its February peak and still under its 200-day average.
The price didn't clear 124.62 until May 13, twelve sessions later. By August 12 it had reached 186.97, which was 46% above that breakout.

And it wasn't alone. Of the stocks we track, CRWD, GEV and HOOD all saw their RS lines reclaim their pre-correction highs before their prices did: HOOD by 5 sessions, GEV by 9 and CRWD by 21. A chart scan that only looked at price highs would have flagged all of them later.
How to use it with your other rules
- In a correction, build the list, don't trade it. A falling market is when RS lines are easiest to read and breakouts are least likely to work. Note which leaders' RS lines are making new highs, then trade them when the index turns. See a market filter you can actually follow for a simple way to tell when that is.
- Stay with the leaders when the market dips. A leader that holds up while the index takes a breather is often the best breakout you'll see all month.
- Drop names whose RS line breaks. If a leader's RS line falls well below its recent range while the market is fine, it's telling you the money has moved on.
- Don't confuse "down a lot" with "cheap". A stock 80% off its highs that bounces 30% has absolute strength and relative weakness. The leaders are near their highs, not far from them.
Start every week with the leaders
Relative strength is a ranking problem, and ranking is tedious by hand. TradePiko does the ranking for you and then shows how your own trades in leaders compare with the rest:
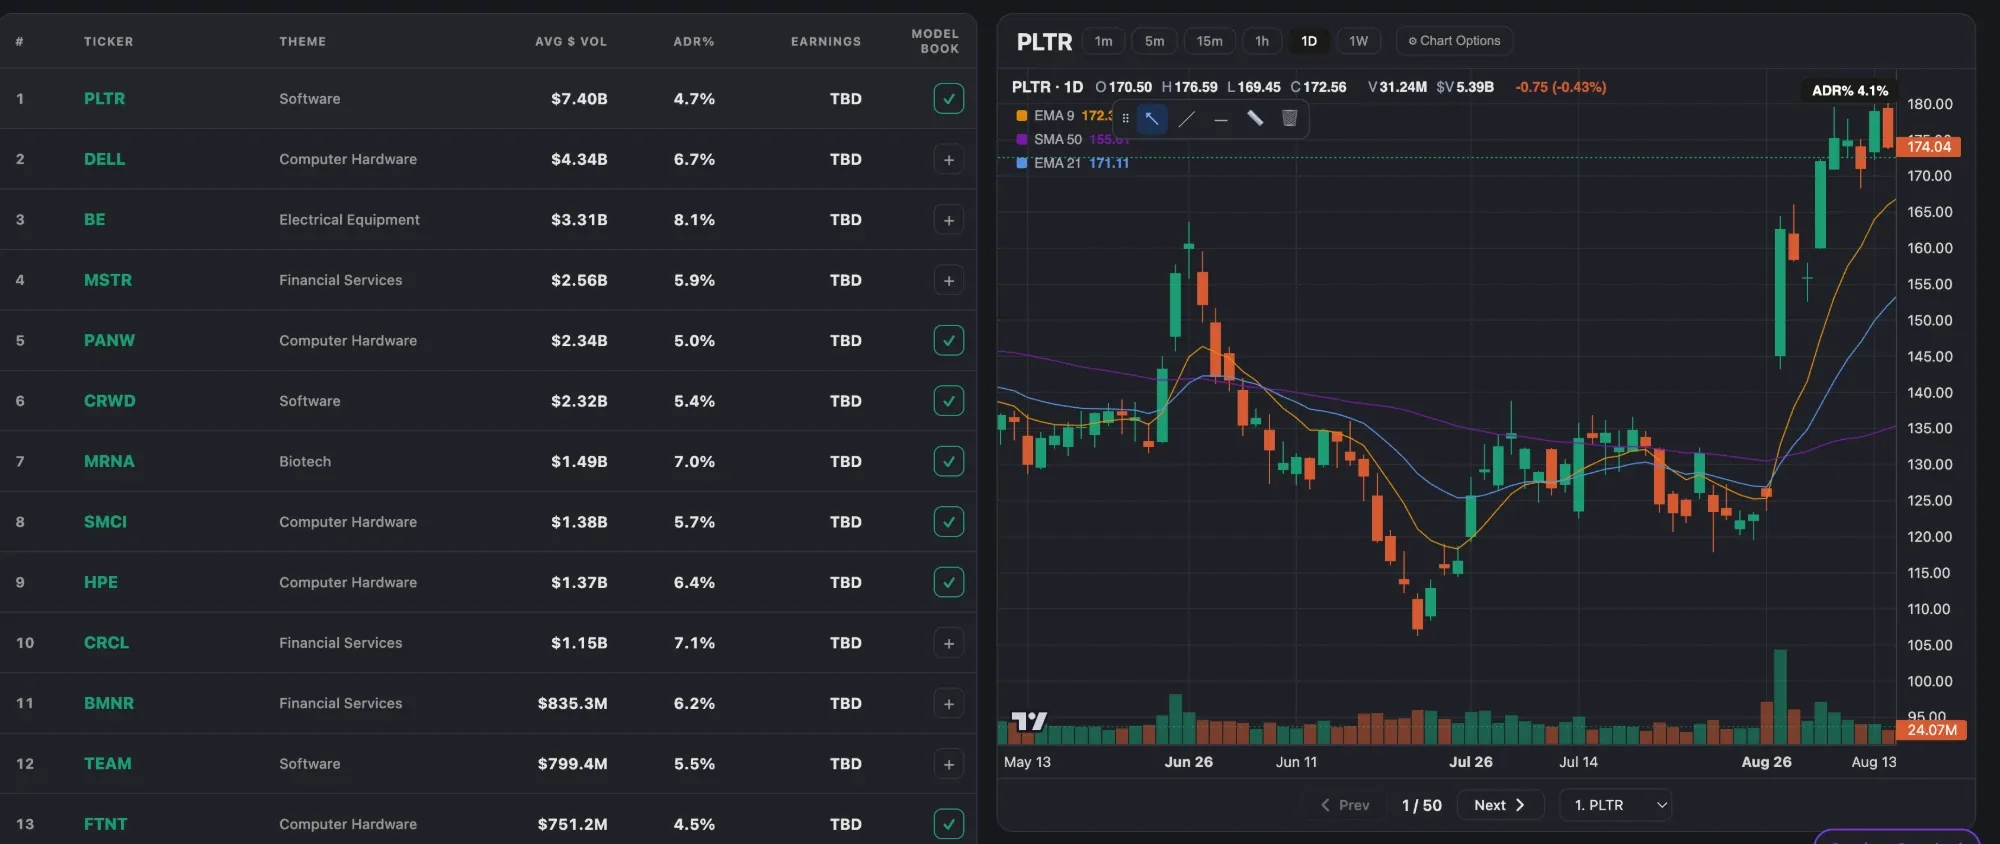
- The PIKO 50. A nightly list of the top 50 momentum leaders, screened for the top 5% of stocks by relative strength, with ADR above 4%, at least $30M a day traded and price above the 65-day average, then ranked by dollar volume, with ADR%, average dollar volume and earnings dates on every name. It covers the first two steps of the routine above.
- Every trade on its daily chart. Each trade you take is charted with your entry and exit, so you can check whether you bought a leader or a laggard that just looked like one.
- Model Books. Save examples like PLTR's spring 2025 RS line into a book, so the next time you see one forming you will spot it.
- AI Trade Coach. Ask your own history whether your trades in PIKO 50 names did better than the others, and how much.
Sources and credits. Scanning the top 1–2% of performers over one, three and six months, and the "tennis ball" view of corrections, are Kristjan Kullamägi's (Qullamaggie), from My 3 timeless setups and his interviews. The figure that big winners beat about 87% of stocks before their runs is William O'Neil's. The 4% figure is from Hendrik Bessembinder's study. Some ideas are adapted from public trader interviews and notes. All examples are illustrative and not a guarantee of future results. Educational content only.