THE PARABOLIC SHORT SETUP.
A parabolic short is a bet that a stock which has gone nearly vertical will snap back once the last buyers are in.
It's a rare setup, and it should be. You need a run that's huge for the size of the company, a final burst of big up days, and then a day when the stock turns on the people who chased it. That day is the trade.
You don't short the strength itself. You wait for the stock to crack during the session, usually by losing VWAP, and the stop goes at the high of the day. Then you cover most of the position into the drop you'd expect for that kind of stock, rather than holding out for a collapse.
It's also the riskiest of the common swing setups, because a short's loss has no ceiling. So the stop isn't optional, and this isn't a setup to learn on.
Why stretched stocks snap back
A stock that rises for days without a pause is being bought by people who are afraid of missing out, and by short sellers forced to buy back. Both groups run out.
Once the last buyer has bought, there's nobody left to absorb the profit-taking from everyone who got in lower. So the price drops back towards where it spent most of its recent time, which is its short-term moving averages.
Kristjan Kullamägi (Qullamaggie) compares it to a rubber band: the further it's stretched, the harder it snaps. The parabolic short is the third of his three core setups, alongside breakouts and episodic pivots, and it's the only one that's usually traded from the short side.
Marios Stamatoudis, for whom it's the only short he takes in stocks, thinks of it as pressure. When a lot of buying gets packed into a few days, nobody has time to adjust, so when the pressure finally releases it comes out all at once. A slow climb lets that pressure leak out along the way, which is why slow runs rarely give clean shorts.
The catch is timing. A stretched stock can stay stretched, and get even more stretched, for longer than seems reasonable. The whole setup is built around not shorting until the band has actually started to snap.
What a good parabolic short looks like
Plenty of stocks are "up a lot". Very few are good parabolic shorts, and the criteria are strict on purpose. If you short too often, you'll keep getting squeezed.
1. A run that's huge for the size of the company
Measure the gain from where the last leg started, which is usually the last time the stock touched its 20-day moving average. Big companies move more slowly, so they need a smaller run to count. Here's the bar Marios uses:
| Company size | Minimum run | Normal range | Extreme |
|---|---|---|---|
| $100B and up | 50% | 50–100% | 80–100% or more |
| $10B–$100B | 100% | 100–200% | Over 200% |
| Under $10B | 200% | 200–1,000% | Over 1,000% |
Run-size thresholds as taught by Marios Stamatoudis. Qullamaggie's bar is similar: 50–100% or more for large caps and 300–1,000% or more for small caps, over days to a few weeks, with at least 3–5 up days in a row.
2. The right shape: big green days at the top
How the stock got there matters as much as how far it went. Marios sorts runs into three shapes:
- Lots of small green days in a row. A steady staircase. Skip it, because the pressure leaks out a little each day.
- Green days broken up by red ones. The most common shape, and also one to skip on its own. The red days let pressure out too.
- At least two big-range green days in a row, ideally gapping up each morning. This is the rarest shape and the one you want, because that much buying in so little time is what sets up the panic.
There's a useful middle ground. A slow run that finishes with one, or better two, big green days on top can work too, and that's the moment to put it on your watchlist.
Either way, one big day isn't enough. Two in a row is the bare minimum before you think about shorting.
3. Stretched far above the moving averages
Measure the gap between price and the 10- and 20-day lines in multiples of the stock's average daily range, so you can compare a volatile name with a quiet one. The further above the averages it closes, in its own units of daily range, the more stretched the band.
4. Extras that add conviction
- Extreme volume. A big spike in volume shows the trade is crowded. If it's the heaviest volume in a year, even better.
- A round number. Big round prices are emotional levels where people like to take profits, so a stock reaching one adds to the case.
- A shaky market. A parabolic stock in a market that's starting to crack has less support under it.
The time window
Once a stock meets the criteria, give it one or two days to show exhaustion. If it doesn't crack in that window, skip it and move on.
That one rule stops you chasing a stock that just keeps going, which is how most parabolic shorts go wrong.
What kind of stock it is, and how far it should fall
Marios groups parabolic runs into three kinds, and each tends to drop by a different amount on the exhaustion day:
- Market leaders at the end of a long uptrend. They're rare, because they need an extended bull market. The typical drop on the exhaustion day is 10–20%, and the 10-day moving average can follow in the days after.
- IPOs that go vertical soon after listing. These are more common, especially when lots of companies are going public.
- Themes and one-off bursts. A theme is a niche group rising together, and a burst is one company running on its own news. This is the kind you'll see most often, and the typical drop on the exhaustion day is 20–40%.
Smaller companies and more extreme runs sit at the top of the range. This expected drop is what the exit plan is built on, so it's worth working out before you ever enter.
How to enter: wait for the crack
The stretched chart is the setup. The trade only starts when the stock shows it has stopped going up, and you see that on the 1- or 5-minute chart.
A true exhaustion day tends to look the same. The stock runs up early, falls back to VWAP (the volume-weighted average price for the day), loses it and stays below it for the rest of the session. It may climb back over VWAP once. If it keeps chopping back and forth across it, this isn't the day.
There are three ways in, from earliest to latest:
- The first sign of weakness. After the opening push, short the break of the first red 5-minute candle's low, or the break of a small range on the 1-minute chart. This is close to Qullamaggie's opening-range-low and first-red-candle triggers. Marios rates it the weakest of the three, because the high of the day is often too far away for a good stop, so he only takes it when the stop is tight.
- The VWAP break. Let the stock fall back to VWAP and short when it breaks below. This is the entry Marios recommends, and it works whether the stock pushed up first or was weak right from the open.
- The first failed reclaim. After the first drop, the stock often bounces back above VWAP and stalls in a small base. Short the break of that base. Marios uses it to add to a short rather than to open one, and only if the stock hasn't already done most of its expected drop. Qullamaggie's failed bounce into VWAP is the same idea.
Give it two attempts at most. If you're stopped out twice, take the stock off your list and move on.
Where the stop goes
The stop goes at the high of the day. For an add on a failed reclaim, it goes just above that small base, which always sits above VWAP.
Before you enter, compare the stop with the expected drop. Marios wants the distance from the entry down to the expected-drop level to be at least about seven times the distance up to the stop. If the high of the day is too far away to pass, wait for a tighter entry, use a stop above a small base just over VWAP, or let the trade go.
That check is what makes the setup worth the risk. A tight stop against a big expected move gives you a lot of R for the same money at risk.
Keep the risk per trade small. Marios risks around 0.4% of the account on a parabolic short, and 0.5% is a common figure. Don't put an outsized slice of the account into one name either, because a halt can trap you.
And never move the stop higher. If the stock trades through the high of the day, the reversal isn't happening today.
When to cover
A parabolic short is a trade back towards the mean, not a bet on a collapse. You already know roughly how far the stock should fall, so plan to cover most of it there.
Measure the expected drop from the high of the setup. If the stock gaps up on the exhaustion day, measure from that new high.
- Take a first partial at 2–3R. It pays for the trade early.
- Cover most of it at the expected drop. Around four-fifths of the position should be gone by the time the stock gets there. After that the move has usually lost its juice and tends to chop sideways, so don't add or re-enter.
- Close the rest near the close. If the stock hasn't reached the expected drop by the end of the day, you can carry a smaller piece overnight, sized like a normal swing trade. From there the 10- and 20-day moving averages are the natural targets, which is where Qullamaggie covers.
The examples below all use one fixed version of these rules. The entry was the first red 5-minute candle if its stop passed the room check, otherwise the VWAP break, and if that failed too, the break of a small base around VWAP with the stop just above it. On the exit, a fifth was covered at 3R, three-fifths at the expected drop and the last fifth at the close. The expected drop was the middle of the stock's range (15% for large caps, 30% for themes and smaller names), moved to the top of the range when the run was extreme for the company's size. Anything still open at the close was carried and covered at the expected drop or the 10-day MA, whichever came first, with the stop left where it started.
Why it's the riskiest setup
A long position can lose at most what you paid. A short position has no such limit. If the stock doubles, you lose twice what you shorted.
And everything else about shorting makes that worse:
- Short squeezes. Parabolic stocks are often heavily shorted already. When they turn up, shorts buying back to cover push the price higher still, which forces more covering.
- Gaps. A stop is an order, not a guarantee. If news hits overnight and the stock opens 20% above your stop, that's where you get filled. That's why Marios keeps overnight positions small.
- Borrow. You need shares to borrow. Hot small caps are often hard to borrow, carry high daily fees, and can be recalled by your broker at a bad moment.
- Halts. Fast movers get paused by volatility halts. You can't exit during a halt, and the stock can reopen far away from where it stopped.
So size the position so that a gap through the stop still wouldn't hurt badly. The method is in position sizing for swing trading.
If you're newer to trading, the honest advice is not to short at all yet. Learn the long setups first, where your worst case is known.
The criteria are still useful if you never short. If you're long a stock that goes parabolic, the same signs tell you when to take bigger profits into the strength, before the moving averages turn.
Parabolic short mistakes to avoid
- Shorting strength. Up five days in a row is a reason to watch, not a reason to sell. Wait for the VWAP break or the first clear sign of weakness.
- Shorting the wrong shape. A slow staircase or a choppy green-red climb doesn't build the pressure the setup needs. Look for two big green days at the top.
- Ignoring the time window. If the stock doesn't crack within a day or two of meeting the criteria, it's not your trade.
- A stop that's too far away. If the expected drop isn't several times the risk, the trade doesn't pay enough for what can go wrong.
- Re-shorting all day. Two attempts, then it's off the list.
- Holding for the collapse. Cover most of it at the expected drop. Adding after that is chasing what's left.
- No stop, or moving it. Use a real order at the high of the day, and never move it higher.
Nine up closes in a row: SMCI, February 2024
Super Micro Computer was one of the market leaders of the AI boom, and in early 2024 it went vertical. It ran +222% in 20 sessions from its last touch of the 20-day MA, with nine up closes in a row, and the last two were its biggest gains of the streak, both gapping higher. For a company its size that's past the extreme mark, it closed 3.6 ADRs above its 10-day MA, and the exhaustion day came on the heaviest volume of the run.

It gapped up once more and lost VWAP within the first few minutes, before the first red candle's low had even broken, so the short went in on the VWAP break with the stop at the high of the day. The room to the expected drop (20%, the top of the range, because the run was so extreme) was about nine times the risk. A fifth was covered at 3R almost straight away, three-fifths when the drop reached 20% in the early afternoon, and the rest at the close, down 20% on the day. +8.6R
An election-theme blow-off: DJT, October 2024
Trump Media & Technology Group (DJT) traded as a bet on the US election, and in the last weeks before the vote it went vertical: +219% in 18 sessions from its last touch of the 20-day MA, which clears the bar for a company its size. The last two days were big-range up days that both gapped higher, and the last one came on the heaviest volume of the run. It closed 3.0 ADRs above its 10-day MA and 5.6 above its 20-day, and Marios flagged on X that day that it met his parabolic criteria.

The next morning it gapped down, so the 30% expected drop for a theme stock was measured from the previous day's high, as Marios does after a gap down. It slipped under VWAP in the first few minutes, and the short went in there with the stop at the high of the day, which left a little over seven times the risk in room. A fifth came off at 3R within the first half hour. The low of the day stopped just short of the expected drop, so most of the rest was covered at the close, down 22% on the day, and the last fifth was held overnight and reached the expected drop the next session. +5.7R
A gap up that reversed: MSTR, November 2024
MicroStrategy (MSTR) rode bitcoin's rally after the US election: +112% in 12 sessions from its 20-day MA, finishing with three big-range up days in a row of 10% or more each. For a company of its size that's at the extreme end. It closed 3.4 ADRs above its 10-day MA and 5.8 above its 20-day, then gapped up again the next morning on the heaviest volume of the run.

The first 5-minute candle closed red, but shorting the break of its low would have left the stop at the high of the day too far away for the room check. The stock was already slipping under VWAP, a little higher up, which gave a stop about half as wide, so that was the entry. A fifth came off at 3R, three-fifths at the 20% expected drop within the first hour, and the last fifth at the close, down 16% on the day. +8.1R
Silver's blow-off: SLV, January 2026
Not every parabolic run is a stock. The iShares Silver Trust (SLV) followed silver's surge into late January: +64% in 18 sessions, with the last five closes all up and the last three days its widest-range days of the run. The company-size thresholds don't really fit a fund that holds a metal, but for silver that's an extreme move, and it closed 3.8 ADRs above its 10-day MA and 7.0 above its 20-day.

It gapped up once more and the first 5-minute candle closed red. The stop at the high of the day was only about 1% away, so even this earliest entry passed the room check easily. A fifth came off at 3R, but the fund clawed back to close flat without reaching the 15% expected drop, so most of the rest was covered at the close and only the last fifth was held overnight. The next morning silver collapsed, and SLV opened below both the expected drop and its 10-day MA on the way to a 28% fall. +5.9R
A vertical run and a 38% reversal: CAR, April 2026
Avis Budget (CAR) had an extreme run: +611% in 22 sessions from its last touch of the 20-day MA, far past even the extreme mark for its size. The last four closes were all up and every one of those days had a huge range, and the last two gained more than 15% each, the final one on the heaviest volume of the run. It closed 3.4 ADRs above its 10-day MA and 7.2 above its 20-day, a one-company burst with the textbook shape.

It gapped up once more, spiked in the first few minutes and then chopped around VWAP. With a range that wide, a stop at the high of the day only left about six times the risk in room, short of the seven Marios wants, so the stop went above the small base the stock built around VWAP instead, and the short went in when that base broke. That gave over twelve times the risk in room against the 40% expected drop (the top of the range, because the run was so extreme). A fifth came off at 3R by mid-morning, three-fifths at the expected drop in the afternoon, and the rest at the close, down 38% on the day. +11.1R
The mirror image: the parabolic long
The same logic works in reverse. When a stock crashes 50–60% or more in a matter of days, the rubber band is stretched the other way.
Qullamaggie's version is to buy the opening-range high or the first green 5-minute candle, with a stop at the low of the day, and to expect a bounce of 50–100% in the best cases. His long example is GBTC in 2017.
The rules mirror the short. Wait for the turn, put the stop at the low of the day, and take profits into the moving averages above. The full setup and real trades are in the parabolic long setup.
Find out whether you short too early
The examples above are stocks, not traders. The question that matters is how your shorts behave, and TradePiko builds that picture from your broker history:
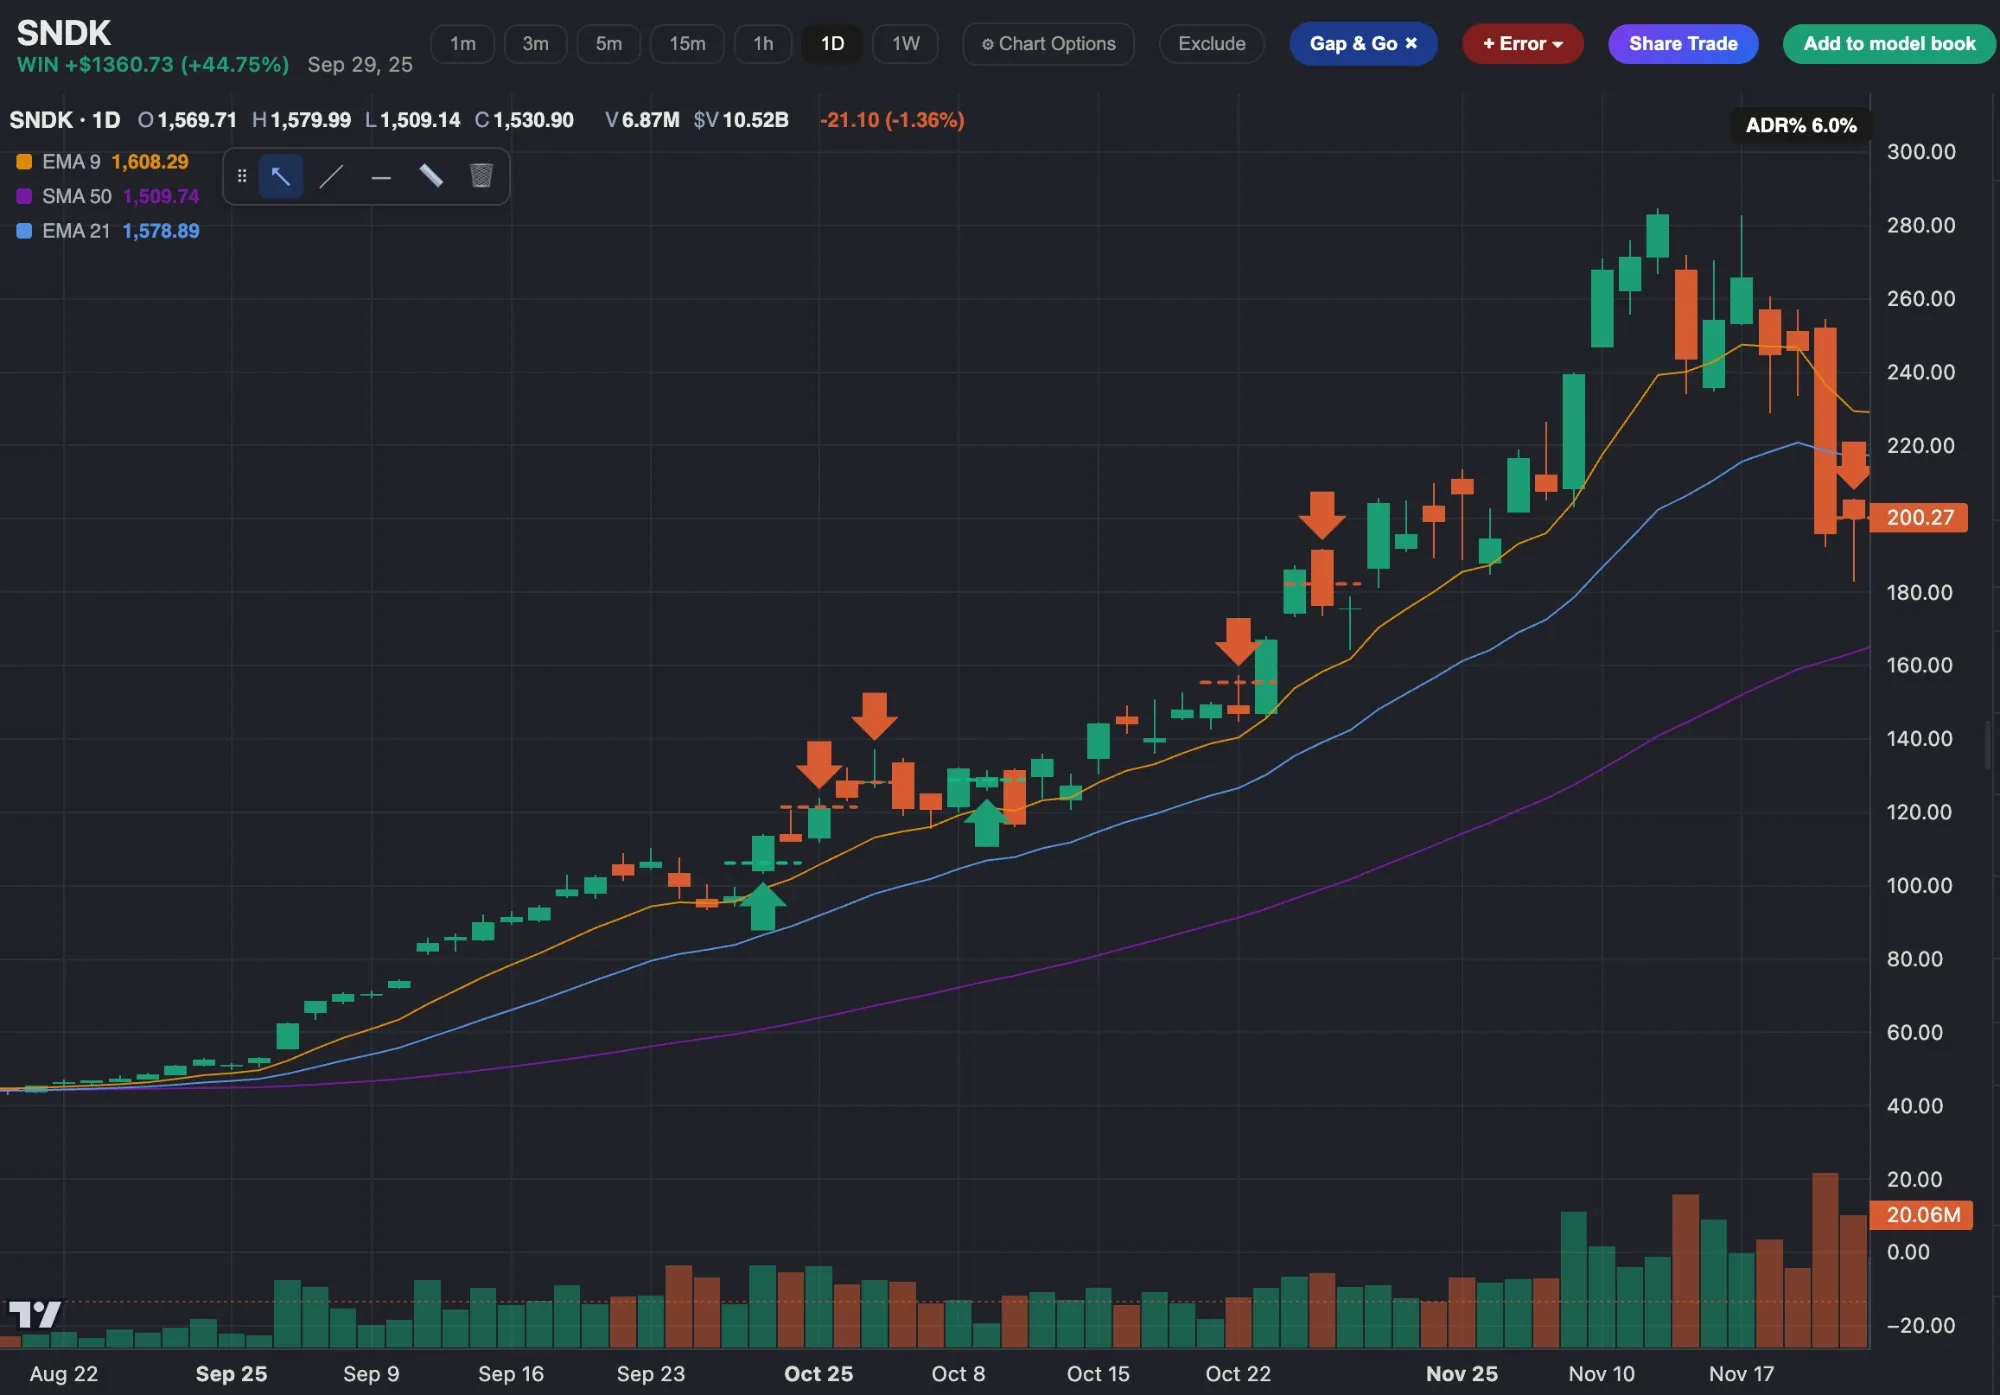
- Every trade on its daily chart. Each short gets its own chart with entry and exit plotted, so you can see whether you sold the crack or sold into a stock that was still going up.
- MFE and MAE on every trade. See how far each short went against you before it worked. If your shorts routinely run 1R against you first, you are early.
- Simulate the exit. Change the exit on any past trade, or exclude your shorts entirely, and compare the result against what you actually did. It is the fastest way to learn whether shorting is adding to your results or costing you.
- Model Books and setup tags. Tag your parabolic shorts and save chart examples of the best and worst ones into a book. Qullamaggie built his edge by studying thousands of past examples.
Sources and credits. The parabolic short and parabolic long setups (the rubber-band idea, the run-size and up-day criteria, the opening-range-low, first-red-candle and VWAP-failure entries, the high-of-day stop and the 10- and 20-day MA targets) are described by Kristjan Kullamägi (Qullamaggie) in My 3 timeless setups that have made me tens of millions. The run-size thresholds by company size, the three price-action shapes, the one-to-two-day time window, the stock categories and their expected drops, the VWAP-break, base-above-VWAP and failed-reclaim entries, measuring the expected drop from the setup's high, the seven-times room check, the 0.4% risk and the scaling-out plan are adapted from Marios Stamatoudis's Momentum Trading Bootcamp. Some ideas are adapted from public trader interviews and notes. The worked trades (SMCI, DJT, MSTR, SLV and CAR, each replayed on 5-minute bars with one fixed version of the rules) are TradePiko's own and are illustrative, not a guarantee of future results. VWAP in the replays is built from exchange-only intraday volume, so it's an approximation. Educational content only.