THEME RECOGNITION: THE GROUP BEATS THE SETUP.
The biggest swing trades rarely happen alone.
When money decides that nuclear power, quantum computing or AI chips are the future, it doesn't buy one stock. It buys the whole group, and for a few weeks or months almost every name in it goes up together. If you're in that group with an ordinary-looking setup, you'll often do better than a trader with a perfect chart in a group nobody wants.
That's the idea behind theme recognition. Before you judge how clean a base is, ask what story the stock belongs to, and whether that story is being bought right now. An average setup in a great theme tends to outperform the best setup in a terrible one, because the theme supplies the buyers and the setup only tells you where to get in.
What a theme is
A theme is a story the market is paying for, expressed through a niche group of stocks that rise together: AI chips, nuclear and uranium, drones, crypto miners, quantum computing, GLP-1 drugmakers.
It's narrower than a sector. "Technology" is a sector, but in a given year the money might be pouring into semiconductors while cloud software goes nowhere.
Marios Stamatoudis puts it plainly in his teaching. Of all the categories of big, fast moves he studies, themes are the most frequent, and they're the ones a momentum trader will deal with most. A theme is many stocks in one niche moving at once. An energy burst, by contrast, is one company spiking on its own news.
Why the group matters more than the chart
Marios explains market moves through what he calls Probabilistic Adjustment Theory: prices move on the market's changing estimates of the future, not on today's facts. Two parts of it explain why themes are so powerful.
The first is herding. When many participants, each with their own weight, reach the same conclusion about the future, they act in the same direction. That's not the market malfunctioning. It's how trends form, and it's why a theme can run far longer than anyone expects. When enough people believe power demand from data centres will explode, they buy every company that might benefit, and they keep buying.
The second is amplification by context. The same piece of news means different things depending on the story around it. A small contract for a nuclear company is a footnote in a quiet year, and a 20% gap when the whole group is in play.
Marios uses this directly when he judges a catalyst, because one of his amplifying factors is simply whether the stock is part of a hot theme or sector. He also points out that big news at one leader can spill over and lift the rest of its niche.
The flip side matters just as much. In some periods certain industries get bought even on mediocre news, while others sell off on good news. If chip stocks are failing on strong earnings while software stocks rally on average ones, that tells you where the buyers are, and it should change how demanding you are with each group.
A strong theme forgives an imperfect chart. A weak one punishes a perfect chart.
None of this is new, either. An old rule among momentum traders says the weakest stock in the hottest group beats the best stock in a cold one. Widely shared notes on leading traders say the same thing in star ratings: in a leading sector, a three-and-a-half-star chart behaves like a five-star one.
Price first, theme second, fundamentals third
Marios ranks the three things he looks at in a clear order: price action first, the theme or phenomenon second, and fundamentals third.
Price action leads because it's the market's real footprint. A fresh, emerging theme can matter more than the company's numbers, because momentum surges in a new story often arrive before the earnings do. Fundamentals are the fuel that makes a move last. And when all three line up (a strong chart in a strong theme, backed by real growth) you have what he calls textbook momentum.
Two cautions follow from that order.
First, the theme never overrules the chart. Marios's warning is never to trust a story or a theme until price confirms it. A theme you can explain but can't see in the charts is an opinion, not a trade.
Second, a theme is a reason to look harder at a stock, not a setup in itself. In his own execution checklist, the stage of the stock, its momentum characteristics and a recognisable setup are required, and the theme is the bonus that raises conviction. The examples below fit that: the setup still mattered, but the group decided how much it paid.
Mark Minervini describes a similar shift in his own process. He works from the stock up, then looks at its group, then at the market, rather than starting with the market and working down. The group sits between the stock and the market, and it's often where the real information is.
Fresh themes and finished themes
Every theme has a life cycle, and when you join it matters.
Early on, only a few names are moving and most traders are sceptical. In the middle, the group breaks out together and the leaders keep making new highs. Late in the cycle, everyone knows the story. The charts go nearly vertical, laggards and low-quality names start running, and people who never talk about stocks start talking about this one.
Marios's work on the end of a move is useful here. He describes a late, exhaustion phase marked by a steep change in slope, large-range days and gaps, crowded volume, and the story being everywhere on social media. When a theme name finally cracks from that state, his notes put the first-day drop at roughly 20% to 40%, with more to follow as the downside momentum builds.
Themes come in together, and they tend to go out together.
His research on where the year's best performers come from points the same way: from the new, the compressed, the neglected, or the fast continuation of something just emerging. So a theme that has gone sideways for a year and starts to wake up is a far better place to look than one that has already tripled.
How to recognise a theme early
- Look for clusters. When three or four names from one niche show up on your scans or watchlist in the same week, making new highs or breaking out together, write the niche down. One stock is noise. A cluster is a theme.
- Sort your leaders by industry. A list of the strongest stocks in the market, sorted by group, shows you at a glance where the money is concentrated.
- Read the news for spillover. When a leader gaps on a big contract or approval and its peers move in sympathy without any news of their own, the market is buying the story, not just the company.
- Check the group, not just the stock. Before you buy, look at four or five sister stocks. Are they near highs, above rising moving averages, holding up on down days? Or is your stock the only one still trying?
- Prefer fresh over famous. A group starting to move out of a long base is earlier in its cycle than one everyone has been posting about for months.
- Keep watching after you buy. If the group rolls over while your stock still looks fine, your stock is usually next.
Six groups from 2020 to 2025
Here are six real groups, from 2020 to 2025, that ran as a pack, each with one stock's breakout inside it.
Every trade is walked through the same way, using the breakout rules from our breakout guide. The entry is the top of the base, or the open if the stock gapped above it. The stop is the breakout day's low, but never more than one ADR below the entry and never closer than a third of one. A third is sold at the close of day five, and the rest is held until the first close below the 10-day average.
EVs and clean energy, summer 2020
In summer 2020, anything tied to electric cars or clean power moved as one. Between May and August all eight names below rose, from 25% for Enphase to 562% for Blink Charging.
Tesla (TSLA) had already run 159% off its March low, then rested for about four weeks in a base. At the end of June 2020 it traded through the top of that base on one and a half times its average volume.

The entry was the top of the base, and the stop went under the breakout day's low, a little over 2% away. A third came off on day five, and the rest stayed above the 10-day line for another two weeks, for +18.4R in all.
Tesla had plenty of company. While the trade was on, Sunrun more than doubled, and NIO and Blink each rose by more than two-thirds.
AI chips, spring 2023
In spring 2023 the market decided AI would need far more chips and servers than anyone had planned for. Between late April and late July all eight names below rose, from 13% for Arista to 245% for Super Micro.
Marvell (MRVL) had spent about eight weeks in a base. In May 2023, on the day Nvidia gapped on its AI forecast, Marvell gapped above the top of its own base in sympathy, on more than three times its average volume, before it had reported anything itself.

The entry was the open. The breakout day's low was more than one ADR away, so the stop sat at one ADR instead. Marvell's own earnings came out that evening and it gapped again the next morning. A third came off on day five, and the rest went two weeks after the breakout on the first close below the 10-day line, for +7.8R.
That's spillover in action: one leader's news lifted the whole niche. While the trade was on, Super Micro rose 56%, and Nvidia, Vertiv and Marvell itself each gained more than a quarter.
Bitcoin stocks, winter 2024
After the first US spot bitcoin ETFs started trading in January 2024, money poured into anything tied to bitcoin. Between late January and late April all eight names below finished higher, led by MicroStrategy at 197% and CleanSpark at 192%, while Marathon and Riot lagged far behind.
MicroStrategy (MSTR) had risen 83% off its October low, then built a tight two-week base. In February 2024 it gapped above the top on almost twice its average volume.

The entry was the open. The day's low was closer than a third of an ADR, so the stop went at that minimum distance instead. A third came off on day five, and the rest went about a week later on the first close below the 10-day line, for +15.7R.
Again the whole group moved with it. While the trade was on, CleanSpark rose 76%, and Coinbase, Marathon and Riot each gained more than 30%.
Nuclear and power, spring 2025
In spring 2025, nuclear and power stocks moved as one. Between April and July all eight names below rose, from 32% for BWXT to 238% for Centrus Energy.
Cameco broke out in May 2025 from a short, shallow base after a strong run off its April low. It gapped above the top of the base on more than three times its average volume.

The entry was the open, and the stop went under the breakout day's low, under 2% away. A third came off on day five, and the rest stayed above the 10-day line for another month, for +11.6R in all.
The tight stop did a lot of the work. But the stock only got that far because the whole group kept rising underneath it for six weeks.
AI data centres, summer 2025
In summer 2025 the market decided that a handful of former bitcoin miners and cloud upstarts were really AI data-centre landlords, and it re-rated the whole group. Between July and October, five of the six names more than doubled, led by IREN at 303%. CoreWeave was the odd one out and finished slightly down.

Nebius (NBIS) had risen 175% off its April low before building a base, and in August 2025 it gapped above the top on almost four times its average volume. The entry was the open. The day's low was closer than a third of an ADR, so the stop went at that minimum distance instead.
A third came off on day five, and the rest went a few days later on the first close below the 10-day line, for +2.4R. A small win, and the group was nowhere near done. Over the next two months Nebius rose another 87%, while IREN and Cipher each gained more than 260%.
That's a useful side of theme recognition too. An exit rule will sometimes take you out of a stock while its group is still leading, and the group is the reason the name stays on your watchlist after you're out.
Quantum computing, autumn 2025
Quantum computing is a small group, only four well-known names, and in autumn 2025 they moved like one stock. Between August and October, Rigetti rose 214%, D-Wave 126% and IonQ 64%, and Quantum Computing Inc. was up as much as 66% before fading.

Rigetti (RGTI) had already run 76% off its June low, then spent four weeks in a base. In September 2025 it traded through the top of that base on almost three times its average volume, and that was the entry. The breakout day's low was more than one ADR away, so the stop sat at one ADR instead.
A third came off on day five, and the rest stayed above the 10-day line for another four weeks, for +16.8R in all.
Rigetti wasn't alone, which is the point. While the trade was on, D-Wave more than doubled and IonQ rose by a third. The whole niche was being bought, and Rigetti rode that wave.
All six are past examples, chosen to illustrate the idea, not a pattern that repeats on schedule.
Putting it to work
- Find the theme before the setup. Build your watchlist from the groups that are working, then look for the cleanest entries inside them. A slightly messy base in a strong group deserves more of your attention than a perfect one in a weak group.
- Be suspicious of the obvious theme. If a group has already run for months and everyone's talking about it, new breakouts there are more likely to be late.
- Demand more in weak groups. If you trade outside the leading themes, ask for a better setup, a smaller position or a tighter stop. When the group is weak, the stock has no tailwind to save a mediocre entry.
- Watch the sister stocks every day. When three or four names in your group break down, tighten your stop or take profits on your position, even if its own chart still looks fine.
- Tag your trades by theme. After a few months, your own journal will tell you which groups you make money in, and whether your best trades came from the leading story of the time.
See which groups lead, and which ones paid you
Theme recognition starts with knowing where the strength is and ends with knowing where you made your money. TradePiko helps with both:
- PIKO 50 Watchlist. A nightly list of the top 50 momentum leaders, each shown with its industry, so you can see at a glance which groups dominate the market's strongest stocks.
- Industry on every trade. Add the Industry column to your trades table and sort your history by group to see where your wins and losses really came from.
- Tags. Tag each trade with its theme, such as "AI chips" or "Nuclear", and read your win rate and average P&L theme by theme.
- Trade Simulation. Use the By Tag preset to see what your account would have looked like if you had only traded your best themes.
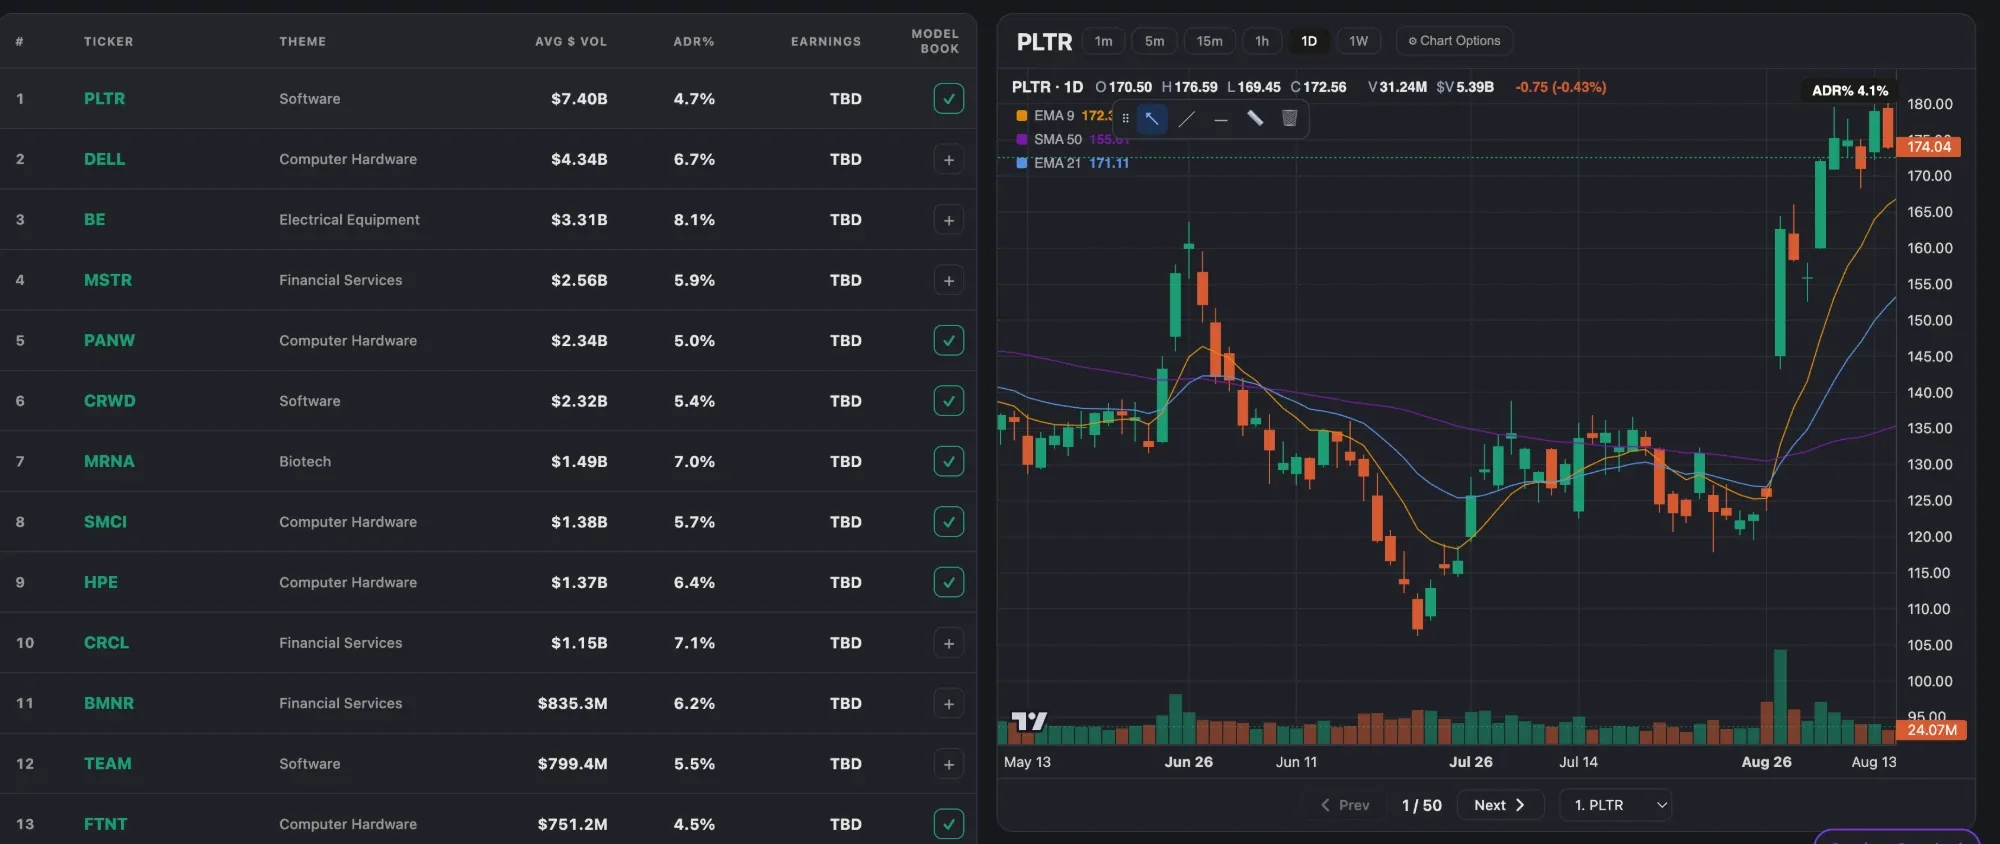
- Model Books. Save the charts of a theme's leaders as it plays out, so you recognise the next one sooner.
Sources and credits. The framework for themes in this post (Probabilistic Adjustment Theory, herding and amplification by context, the ranking of price action over theme over fundamentals, theme spillover and amplifying factors in news, industry breadth, the theme as a bonus factor, exhaustion behaviour and where the best performers come from) is paraphrased from Marios Stamatoudis's Momentum Trading Bootcamp. Mark Minervini's stock-then-group-then-market order is from notes on his interviews. Some ideas are adapted from public trader interviews and notes. The group charts and worked trades are TradePiko's own, from real daily bars; the trades follow the breakout rules described in the post and are past examples, not a guarantee of future results. Educational content only.