HOW TO SCREEN STOCKS FOR SWING TRADING.
Most swing traders spend their energy on entries and exits, and very little on the question that comes first: how do you find stocks to swing trade at all?
That's what screening is for. You run a stock screener over the whole market and keep only the few names worth a closer look. And it matters, because the biggest moves are concentrated in a small number of names, and a perfect breakout in a sleepy stock rarely goes anywhere.
Finding the right stocks is most of the job.
The method the traders this blog draws on use is simple. Rank every stock by how much it has gone up over the last one, three and six months, and keep the top 1–2%. Throw out the ones too illiquid or too quiet to trade, and then look at the charts by eye.
On October 30, 2026, that process took 5,119 US stocks down to 38. Then the work narrows again, first to a focus list of a handful of names with a setup forming, and then to a daily list of the few you'd actually buy tomorrow.
Why you hunt among the leaders
A swing trade needs a stock that moves, and moves in one direction for a few days or weeks. Most stocks don't.
So you go where the moves are. Hendrik Bessembinder found that about 4% of US stocks produced all of the market's net gains from 1926 to 2016. And William O'Neil's research found that the biggest winners were already outperforming about 87% of stocks before their major moves. The leaders are rarely hiding.
Qullamaggie adds the reason it keeps working. The stocks that have made the biggest moves tend to keep making the biggest moves, as long as they're real companies with real earnings rather than pumps.
So a momentum trader starts from the strongest stocks, not the cheapest, and only then looks for a pattern. He also wants a reason for the move, such as a hot sector, fast growth or a catalyst. A neat chart on a random stock is rarely worth the trade. (For the concept itself, see relative strength.)
The scans
The sources give three versions, and they differ more in detail than in spirit:
- Qullamaggie: rank, don't threshold. Scan for the top 1–2% of stocks by performance over the last one, three and six months, then look at the charts. In community notes of his streams, the look-backs are 21, 63 and 126 trading days, with the close compared to the close that many bars ago. If a scan returns more than about 50 names, tighten the rank or the volatility filter. He reruns it weekly.
- Fixed hurdles. Momentum screens of 20% in one week, 30% in one month (50% in strong markets), 50% in three months and 100% in six. A scan should return fewer than about 60 names, and it's worth running on two platforms because the results differ.
- Pradeep Bonde (Stockbee): biggest movers. A daily scan for stocks up or down 20% or more in five days, and a weekend scan for stocks up 50% or more in two months, noting the catalyst, how the move started and the market cap.
A ranking adapts to the market. In a quiet tape the top 2% might be up 25% in a month, and in a hot one 60%.
Fixed hurdles do the opposite. They return lots of names in strong markets and almost none in weak ones, which is useful information in itself. Both are worth running.
The filters: range and liquidity
A big mover isn't necessarily a tradable one. Two filters do most of the cleaning:
- Average daily range (ADR). A stock needs to move enough in a day for a swing to be worth the risk. Breakout traders typically want 4% or more, ideally 5%+. A common floor is 3%, some fast-stock traders stick mainly to names above 5%, and Qullamaggie's example scan in his stream notes uses about 6%. See ADR% explained.
- Dollar volume. You need to get in and out near the price you expect. Qullamaggie's rule of thumb is a minimum daily dollar volume of about 200 times your position size, so a $20,000 position wants $4 million a day, and a $100,000 position wants $20 million. A tighter model-book universe uses at least $50 million in 20-day average dollar volume.
A minimum share price is a third, cruder filter. Qullamaggie notes that stocks under about $2 are often near bankruptcy, and many pre-market scans require a price above $10.
Many traders also drop anything below its 50-day moving average, since a stock that has fallen far below it has, in Qullamaggie's words from his streams, lost its momentum.
Theme and sector strength
Leaders come in groups. When several names from one industry show up on a scan together, money is moving into a theme, and that clustering is often an early sign of where the next leaders will come from.
Qullamaggie keeps theme watchlists of the hottest sectors, ranked by liquidity, and says in his streams that in a leading sector a 3.5-star chart behaves like a 5-star one. His line is that holding the weakest stock in the hottest sector beats holding the best stock in a cold one.
Thematic lists catch rotations, like the July 2025 move out of tech into health care, homebuilders, solar and regional banks.
Marios Stamatoudis makes a related point about outliers. The biggest moves come from themes, stories and catalysts at least as much as from perfect patterns. So a filter that keeps only textbook charts, or only great fundamentals, can cut out the very stocks that go on to run.
From scan to focus list
A scan gives you candidates, not trades. The step most people skip is narrowing them down. A focus-list funnel published on qullamaggie.net, a fan-run resource site, uses four levels:
| List | Size | What it is for |
|---|---|---|
| Universe | 300–600 names | Everything worth watching; about 1–1.5 hours to review per 500 |
| Wide list | 50–100 names | Leaders with constructive charts; reviewable in under 30 minutes |
| Weekly focus list | 5–20 names | Setups that could trigger in the coming days |
| Daily list | Fewer than 5 | Each with an entry tactic, stop, size and buy point prepared |
A simpler version runs from a global watchlist (often well over 100 names) to a stalk list to a focus list. Setups often mature days or weeks after the scan first flags them, so a name only moves up to the focus list once it shows contraction.
One practical version keeps an execution list of up to 20 names in good markets, an "almost ready" list of up to 60, and wide lists for the rest. Another narrows to 10–20 names with levels drawn and alerts set, and drops a name when earnings are about a week away (see trading around earnings).
The funnel also tells you something about the market. The qullamaggie.net post points out that week-to-week changes in the number of setups double as a market-health reading, and execution lists shrink to zero in bad markets.
So if your focus list is empty, that's information. It isn't a sign you didn't search hard enough. (See why market environment matters more than your setup.)
The routine
None of this happens during market hours. Here's a routine pieced together from the sources:
- Weekend, 1–2 hours. Run the 1-, 3- and 6-month scans, update the theme lists and rebuild the wide list. A part-time trader can flip 800–1,000 charts in about 1–1.5 hours: bottom-up scans for about 45 minutes, a top-down sector ETF review for about 15 and thematic lists for about 15. Bonde runs his 50%-in-two-months scan at the weekend.
- Each evening, 20–30 minutes. Add the day's biggest movers to a dated list. Qullamaggie tracks a list like that for about a month, dropping names that retrace and keeping the ones that form flags. Move names between the wide list and the focus list, and prepare the daily list with buy points and stops. Running the screeners after the close and keeping a short daily market diary helps too.
- Before the open, about 30 minutes. Set price alerts on the daily list about 30 minutes before the open, check the news and the gap scan, and decide whether today is a day to be aggressive or defensive. An hour and a half before the open is plenty to find stocks in play and decide on offence or defence.
Keep it simple. Qullamaggie sees an inverse correlation between the number of indicators a trader uses and how profitable they are. Keep your screeners simple and wide, and let your eyes be the final filter.
The scan on a real day: October 30, 2026
To see what these filters actually do, we ran them on every US-listed common stock with at least six months of daily data, using the close on October 30, 2026.
The ranking follows Qullamaggie's 21-, 63- and 126-session look-backs. The filters are a $5 minimum price, $20 million of 20-day average dollar volume (enough for a $100,000 position under the 200× rule) and an ADR of at least 4%.

A few things are worth noticing.
The bar for "top 2%" is high. On October 30, it took a gain of 33.5% over one month, 65.1% over three months or 104.4% over six to make the cut. The fixed hurdles were in the same area that day: 135 stocks were up 30% in a month, 160 were up 50% in three months, and 113 were up 100% in six.
Liquidity does the heavy lifting. More than half the top-2% names failed the price or dollar-volume filter. Many of the market's biggest percentage gainers are small, thin stocks you couldn't size into.
It lands where the sources say it should. There were 50 names after the ADR filter, right on Qullamaggie's "more than about 50, tighten it" line. Only 2 of the 50 ranked in the top 2% on all three look-backs, which is why the scan takes any of the three.
The fixed-hurdle version gave a similar list. The 30/50/100% hurdles with the same three filters returned 66 names.
The 50 names also show the theme check at work. Grouped by their SEC industry code, 12 were prepackaged software companies, and another 12 were drug or biological-product makers.
Inside the software group the cluster was tighter still: CRWD, OKTA, TENB, RPD, QLYS, NTSK and RBRK are all security-software names. Three restaurant chains (WING, SG and CBRL) and three medical-lab companies (CDNA, CAI and GRAL) made small clusters of their own.
A trader reading that list would start with the cybersecurity charts. The PIKO 50 on October 23 told a similar story, with 19 of its 50 names in software.
Leaders the scan caught early
We then ran the same scan on every trading day from May 6, 2025 to October 30, 2026, which is 375 sessions. It averaged 65 names a day, and 980 different stocks passed it at least once.
The best leaders of the period didn't show up for a day and vanish. They showed up early, and they stayed:
| Stock | First day on the scan | Close that day | Highest close in the next 6 months | Days on the scan |
|---|---|---|---|---|
| IREN | Jun 27, 2025 | $14.00 | $76.41 (Nov 5, 2025), +446% | 130 |
| BE | Jul 31, 2025 | $37.39 | $165.39 (Jan 28, 2026), +342% | 173 |
| SNDK | Sep 8, 2025 | $70.50 | $695.51 (Feb 3, 2026), +887% | 255 |
| LITE | Oct 29, 2025 | $214.28 | $902.32 (Apr 30, 2026), +321% | 150 |
| MU | Nov 14, 2025 | $246.83 | $803.63 (May 13, 2026), +226% | 119 |
First day on the scan within our period, which starts May 6, 2025. Days on the scan out of 375 sessions to October 30, 2026.

That persistence is the practical lesson, and it holds well beyond the famous names. Across all 375 sessions, 71% of the stocks on the scan on any given day were still on it five sessions later, and 58% were still there ten sessions later.
So you don't need to buy the day a stock appears. You need to notice it, put it on the wide list, and wait for a tight base or a pullback to its moving averages that gives you a low-risk entry.
Of course, these are the best examples out of 980, and plenty of the others went nowhere or fell hard. A momentum scan finds stocks that move, in both directions, so the chart, the entry and above all the stop are what turn the list into trades.
Building your own routine
- Pick one scan and run it on a schedule. The ranking version (top 2% over one, three or six months) is the simplest place to start. Run it at the weekend without fail.
- Set your filters from your account size. Work out your typical position, multiply by 200, and use that as your dollar-volume floor. Then choose an ADR range you can actually sit through.
- Prefer the liquid leaders. Any pure price scan also picks up thin pump-and-dump names and stocks bouncing after reverse splits, which often collapse within weeks. The real companies trading big dollar volume are the ones worth your time.
- Keep the funnel small at the bottom. A focus list of 5–20 and a daily list under five. If you can't say exactly where you'd buy and where your stop is, the name isn't ready.
- Review what you traded against what the scan offered. Once a month, compare your trades with the best setups the list produced. It belongs in your review routine, and the misses tell you as much as the trades do.
Then trade the setups. Breakouts, flags, pullbacks to the moving averages and episodic pivots all start from the same list.
The scan, done for you every night
Running the scan above means downloading data for 5,000 stocks and ranking them. TradePiko's Pro plan does that every night:
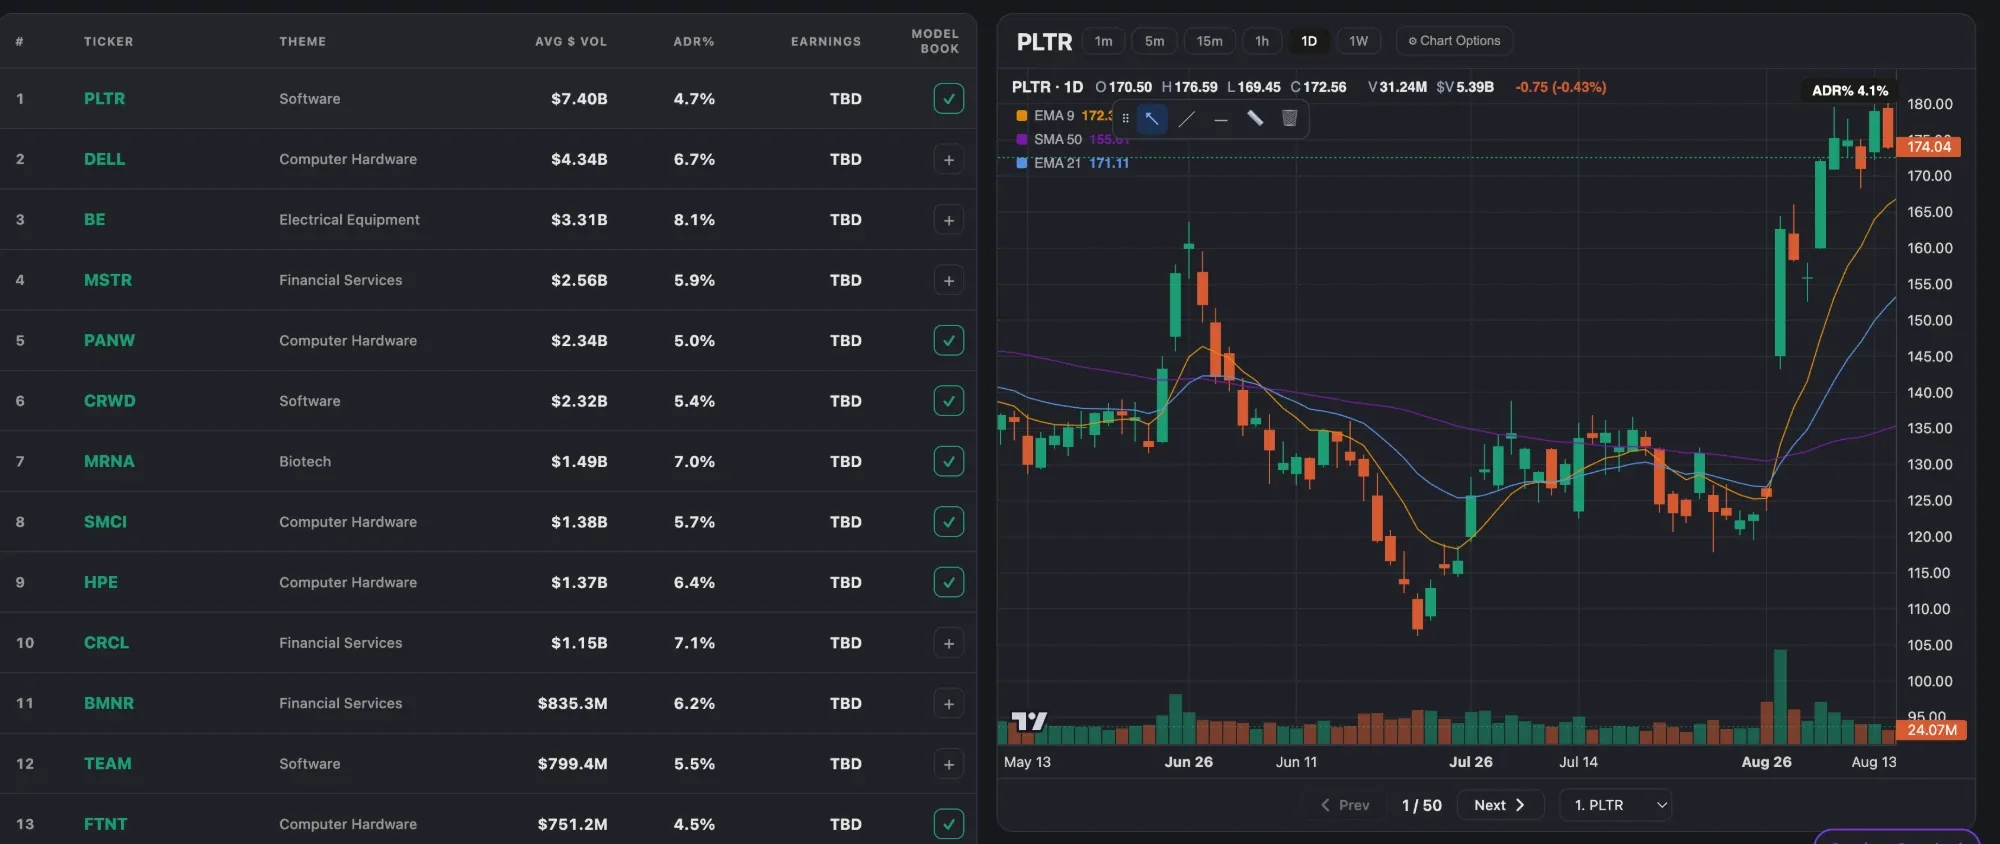
- The PIKO 50. A nightly list of the top 50 momentum leaders, screened for the top 5% of stocks by relative strength, with ADR above 4%, at least $30M a day traded and price above the 65-day average, then ranked by dollar volume. Every name shows its ADR%, average dollar volume and next earnings date, so the range, liquidity and earnings checks are already done. On the October 23, 2026 list, every name had an ADR of at least 4.0%, and the thinnest traded $97 million a day.
- Model Books. Tick a PIKO 50 name into a model book straight from the list, and build a library of the setups you want to catch next time.
- Every trade on its daily chart. Once you trade a name, it is charted with your entry and exit, so you can check whether you bought the setup or chased the scan.
- AI Trade Coach. Ask your own history whether your trades in PIKO 50 names did better than your others.
Sources and credits. The top 1–2% scan over one, three and six months, the 21/63/126-bar look-backs, the "more than about 50" rule, theme lists, the 200× dollar-volume rule, the dated movers list and the weakest-stock-in-the-hottest-sector point are Kristjan Kullamägi's (Qullamaggie), from My 3 timeless setups, fan-compiled notes of his streams and his Chat With Traders interview. The four-level funnel is from qullamaggie.net's creating a focus list (no byline). Pradeep Bonde's (Stockbee) biggest-movers scans are from his public blog and interviews. The Bessembinder and O'Neil figures are from their published research. The outlier point is Marios Stamatoudis's, from posts on X. The scans are TradePiko's own and are illustrative, not a guarantee of future results. Some ideas are adapted from public trader interviews and notes. Educational content only.