HIGH TIGHT FLAGS.
A bull flag is a short rest in a stock that has just made a sharp move up.
The fast advance is the pole. The few days or weeks of quiet, sideways-to-slightly-lower trading after it are the flag. And when the stock leaves the flag to the upside, the bet is that the next leg has started.
A high tight flag is the extreme version: a stock that roughly doubles in a couple of months and then barely gives anything back. It has a reputation as one of the most powerful patterns of all, and when one works, the move can be enormous.
Where the flag fits
Leading stocks rarely go up in a straight line. They climb in steps.
There's a sharp leg higher, then a pause while early buyers take profits and the move gets digested, then another leg. Kristjan Kullamägi (Qullamaggie) builds his breakout setup on that staircase, and it comes in three parts. First, a big move of roughly 30–100% or more over days to weeks. Then an orderly pullback or consolidation, with higher lows and a narrowing range, while the stock rides its rising 10- and 20-day moving averages. And then a range-expansion breakout.
A flag is that middle step at its shortest and tightest. Qullamaggie lists high tight flags, flat channels and triangles as variants of the same setup, and he notes that the pattern shows up on weekly and intraday charts too. So you're not learning a separate method here. It's the breakout setup, applied to a stock that's moving fast. Our post on how to trade breakouts covers the full process, from scanning to selling, and this one is about reading the flag itself.
The reason a flag works is the same reason any tight base works. If a stock has just run hard and then holds most of the gain in a narrow range, it's showing you that sellers are scarce. Most stocks that rally sharply give a large part of it back. So one that stalls near its highs, on falling volume, is being held by people who expect more. And when it breaks out, your stop can go close by, which is where the payoff comes from.
The anatomy of a flag
The pole. This is a fast, steep advance, often on heavy volume and often started by news. A slow drift up isn't a pole. The pole is your evidence that big buyers want the stock now.
The flag. A pause of days to a few weeks that gives back only a modest part of the pole. Qullamaggie describes momentum stocks often retracing about a third of their run before they find support. The bars get smaller toward the right side, and volume fades.
Support. In the best flags, the stock holds its rising 10- or 20-day moving average, or undercuts it briefly and reclaims it. Support after a big run is a sign of strength in itself, because most stocks don't find any.
The breakout. Price leaves the flag on a wide-range day (ideally the widest bar in a week or two), on clearly higher volume than normal.
Pradeep Bonde (Stockbee) describes a closely related short-term setup, the momentum burst, and it has similar ingredients: an orderly, low-volume consolidation, preferably under ten days, often with a narrow-range or down day just before the breakout. Different traders, but the same picture. A tight pause in a stock with momentum.
The high tight flag
The high tight flag is the pattern William O'Neil popularised in How to Make Money in Stocks, and Mark Minervini calls his version a power play.
The commonly cited version has two demanding parts. First, the stock roughly doubles (+100% or more) in about 20 to 40 sessions, which is four to eight weeks. Then it corrects by less than about 20% (some allow 25%) over roughly 5 to 25 sessions. O'Neil's own rules and examples are in the book.
The anatomy of the pattern tells you what's going on inside it:
- The pole is a sharp, fast rise on high volume, often starting with an episodic pivot.
- At the top, buyers dry up and early holders take profits.
- The shallower the pullback, the stronger the stock. Resistance forms, volume fades and the weak hands leave.
- The breakout combines new buyers, holders buying back in and short sellers covering.
- A bigger pole built faster means a stronger stock, but also a deeper pullback. The more parabolic the pole, the lower the odds of a second leg, and any continuation usually needs a longer base.
That last point is the catch. A stock that has just doubled in a month is stretched, and a five-day flag on top of it is often too short for the stock to digest the move.
Qullamaggie also likes shakeouts inside the flag: a quick drop below support that reverses. They flush out weak holders and trap shorts. So some of the best flags look messy for a day or two.
What makes a flag constructive
Most of these come from community notes of Qullamaggie's streams, as compiled by a fan, so treat them as his practice rather than his written rules:
- Wait for the 20-day to catch up. He said flags that break before the 20-day moving average has caught up with price fail more often. A stock that's still far above its 20-day is stretched, and the flag needs time.
- Rising averages. On the best names, the 10- and 20-day lines slope up steeply, at roughly 45 degrees.
- Volume on the break. Above-average volume should confirm the breakout.
- Longer is better. Longer formations are generally more powerful, and weekly flags that move sideways for three to four months are very strong.
- Early beats late. Later-stage flags after a huge run are lower probability than the first or second.
- The group matters. In a leading sector, a 3.5- or 4-star chart behaves like a 5-star one. A great flag in a cold group is a weaker trade.
- Momentum is lost below the 50-day. Once a stock has fallen far below its 50-day line, it's no longer a flag. It's a broken chart.
And the usual breakout rules still apply. Only trade flags in stocks that are already leading (see relative strength and how to find stocks to swing trade), with enough average daily range and liquidity, in a market that's rewarding breakouts.
Entry, stop and exit
The trade itself is just the breakout trade, so we'll keep this brief:
- Entry: a buy-stop just above the top of the flag, or the opening-range high on the day it breaks. Qullamaggie buys the break rather than anticipating it.
- Stop: the low of the breakout day, never wider than one ADR. If a flag's range is wide, he suggests a small starter position, adding once it tightens on the 60-minute chart.
- Exit: sell a third to a half after three to five days, move the stop to break-even, and trail the rest with the 10- or 20-day moving average, getting out on the first close below it. (See 10-day vs 20-day for the trade-off.)
Flags give you tight stops, because the breakout day starts close to the flag's top. That makes position size the main lever, and it means gap risk matters. Twice the shares on a tight stop is twice the damage if the stock gaps through it. So avoid buying a flag into an earnings report (see trading around earnings).
A definition you can scan for
"A short, tight pause after a sharp move" is easy to recognise and hard to pin down. So here are rules precise enough to scan for, kept close to Qullamaggie's numbers where he gives them:
a rise of at least 30% from the lowest low to the flag's top, within 40 sessions
Flag
5 to 25 sessions that never trade above the top
low no more than 25% below the top, and giving back no more than half the pole
Breakout
the first session to trade above the flag's top
High tight flag
the same, with a pole of at least 100%
The high tight flag rule takes the most generous of the commonly cited limits: a pole of 100% or more inside eight weeks, and a flag up to 25% deep. It also helps to require a share price of at least $5 and $20 million a day of average dollar volume, so every trade can be sized.
A tight flag in a steady leader: ANET in 2018
Arista Networks (ANET) at the turn of 2018 showed the quiet version. Its pole was a stair-step climb of 36% over about eight weeks, and then it rested for six sessions in a flag only 6% deep, sitting right on its rising 20-day line.

In January it broke out of the flag on 2.1 times its average volume. The buy-stop sat at the top of the flag, and the stop went under the low of the breakout day, barely more than 1% away. A third came off on day five, and the rest rode the 10-day line until the first close below it in early February.
The stock only rose 14% from entry to exit, but on a stop that close it came to +8.7R.
A two-week flag on a fast mover: TSLA in 2020
Tesla (TSLA) in spring 2020 had a 52% pole in seven weeks. Then it spent 14 sessions in a flag 12% deep, drifting sideways while both the 10- and 20-day lines climbed up underneath it.

At the end of June it traded through the flag's top on 1.5 times its average volume, with the stop under the breakout day's low. A third sold on day five, after a fast run, and the rest rode the 10-day line until the first close below it in late July.
The stock gained 47% from entry to exit, which came to +18.4R.
A deeper flag on a fast pole: AFRM in 2023
Affirm (AFRM) in November 2023 sat near the edge of the rules. It ran 70% in just 11 sessions, with gaps along the way, and the first day of the flag gave back a lot. That made the flag 20% deep. But after that shakeout the next ten sessions were tight, volume dried up, and the 20-day line rose fast to meet price.

Late in November it broke out on 2.9 times its average volume. The day's low was closer than a third of an ADR, so the stop went at that minimum distance instead. A third sold on day five, and the rest rode the 10-day line into January.
The stock rose 72% from entry to exit, for +26.9R.
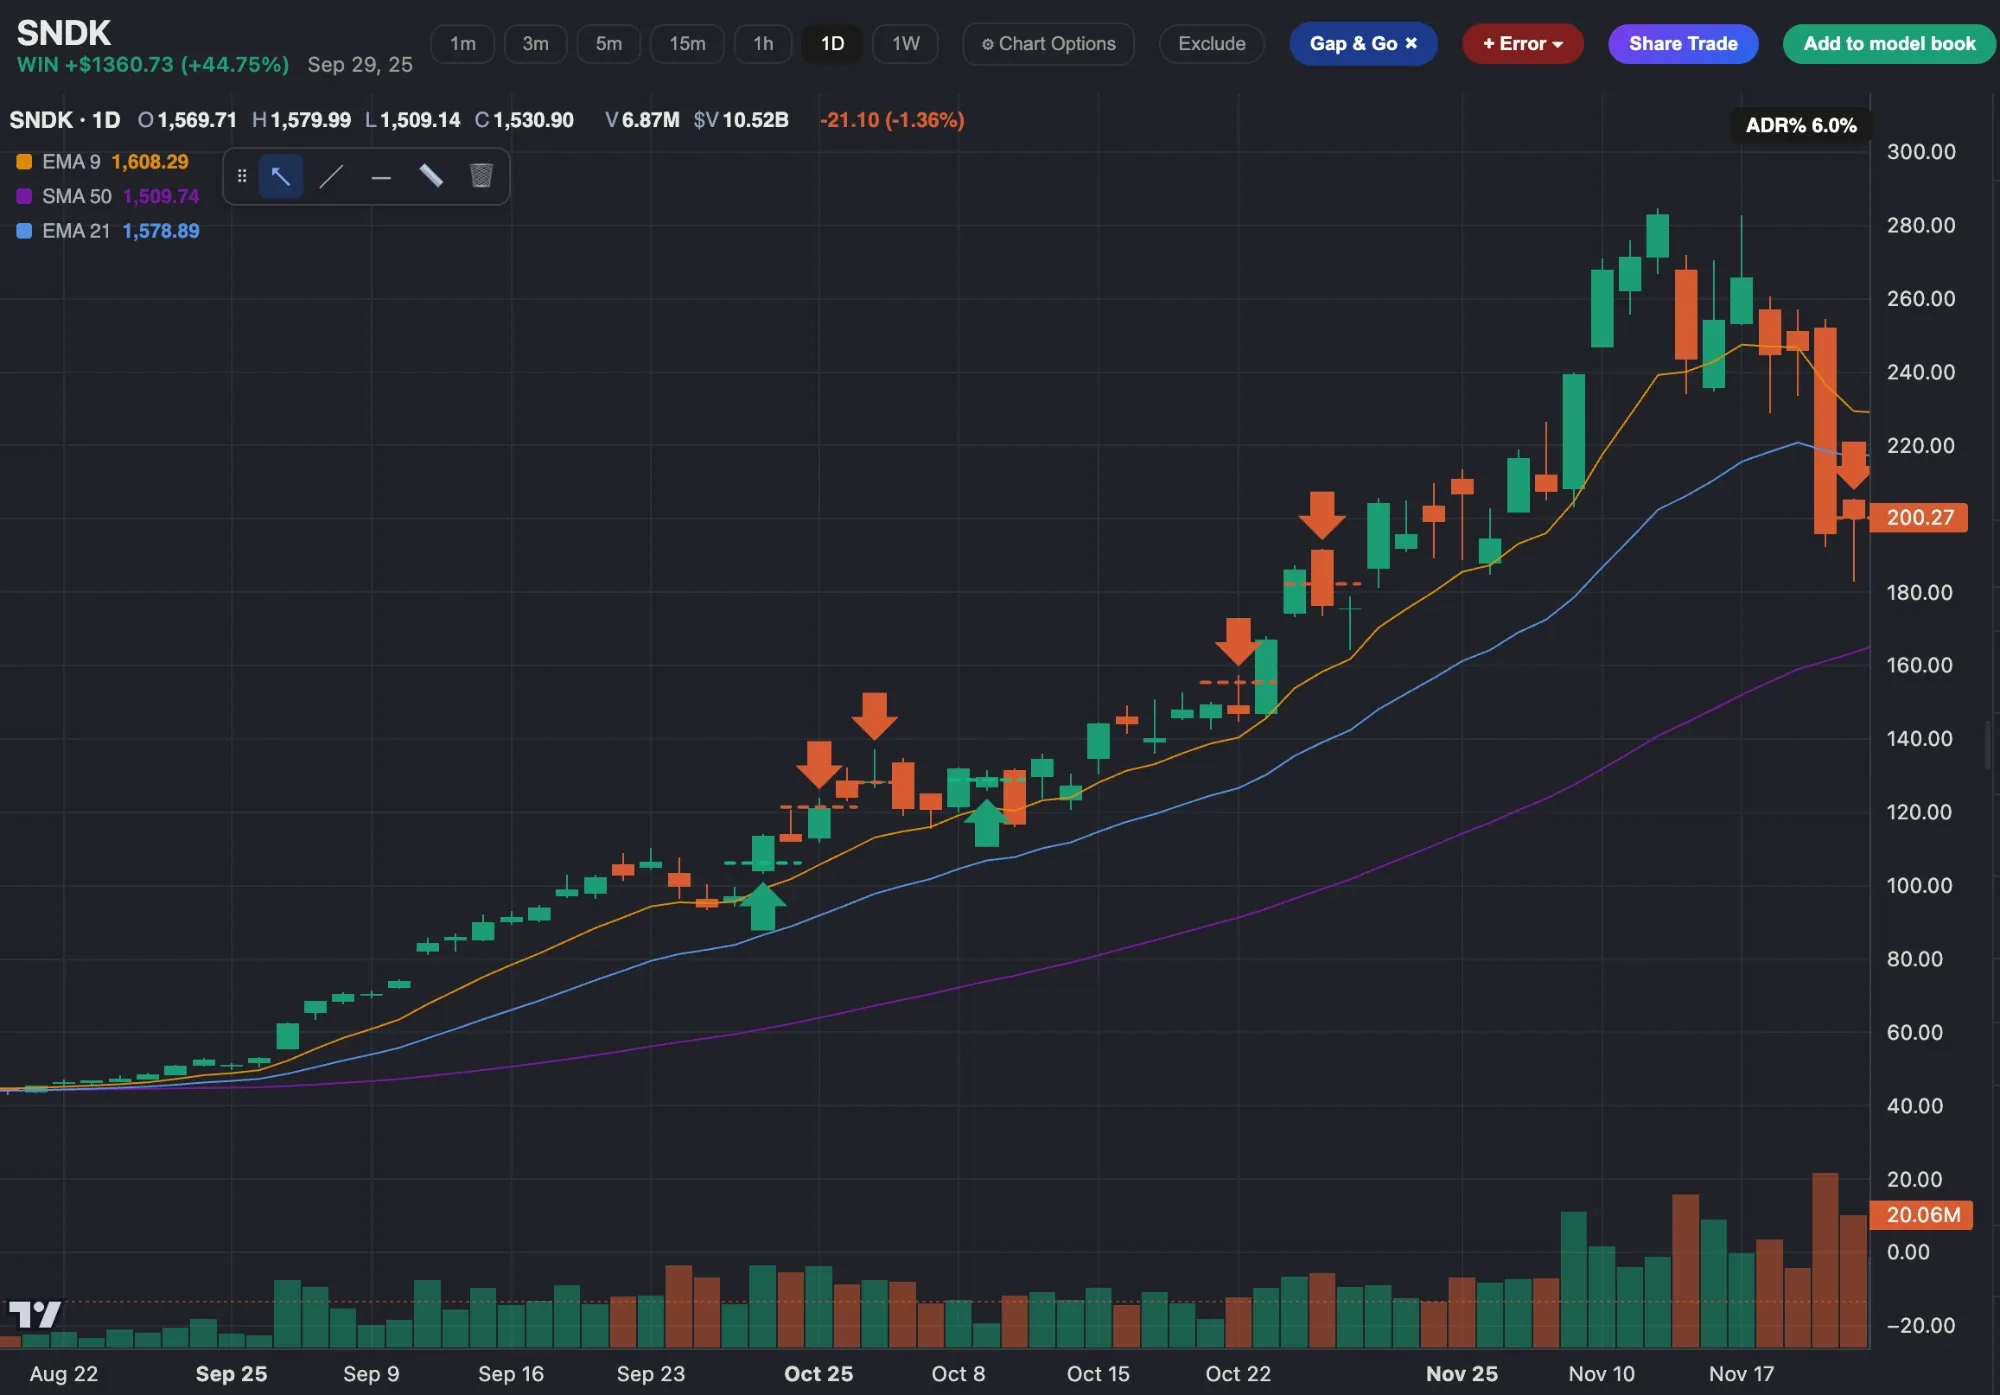
A high tight flag that worked: RKLB in 2024
Rocket Lab (RKLB) in autumn 2024 was close to the textbook. It more than doubled in about seven weeks (up 111%), then rested for nine sessions in a flag only 15% deep while the 20-day line rose to meet it.

In November it opened above the flag's top on 1.5 times its average volume, so the entry was at the open. The day's low was closer than a third of an ADR, so the stop went at that minimum distance instead. A third came off on day five, and the rest rode the 10-day line until the first close below it in December.
That came to +37.8R, and most of it was the tight stop at work. The stock went up 87% from entry to exit, and a 2% stop turned that into a very large multiple. As the tight-stop post explains, the same move on a 7% stop would have been worth a fraction as much.
ARM in May 2026, the worked trade in our breakouts post, also qualifies as a high tight flag under these rules, with a pole of just over 100% and a shallow flag.
An ordinary flag that became a trend: GRAL in 2025
GRAIL (GRAL) in 2025 showed that the pole doesn't need to be huge. It rose 35% in three weeks, then spent six sessions in a flag only 9% deep.

In September it broke out of the flag on 2.3 times its average volume, with the stop under the low of the breakout day. A third sold on day five, and the rest rode the 10-day line for about two months, until the first close below it. That came to +27.7R.
A flag that started with a gap: NTRA in 2026
Natera (NTRA) in summer 2026 built its pole on a big gap up on heavy volume, the kind of start an episodic pivot gives you. It kept climbing to a 38% gain in about a month, then rested for 12 sessions in a flag only 8% deep while the 20-day line caught up.

In September it broke out on 1.6 times its average volume, with the stop under the low of the breakout day, about 1% away. A third came off on day five, and the rest rode the 10-day line until the first close below it in early October.
The stock rose 17% from entry to exit, which came to +12.4R on that tight stop.
Finding your own edge in flags
A flag is easy to see after the fact and much harder in real time. So the useful work is checking how your own flag trades behave:
- Tag every flag breakout you take, and compare its results with your other setups. If your flags lose money, find out which part of the definition you're bending.
- Note the breakout volume and the distance from the 20-day on each one. If your winners cluster in high-volume breakouts near the 20-day, make those requirements.
- Save the best and worst examples. You learn the difference between a tight flag and a sloppy one from dozens of charts, not from a definition.
Find the flags, then judge your own
A flag is only worth trading in a stock that is already leading, and only worth repeating if your own flag trades pay. TradePiko helps with both:
- The PIKO 50. A nightly list of the top 50 momentum leaders, screened for the top 5% of stocks by relative strength, with ADR above 4%, at least $30M a day traded and price above the 65-day average, then ranked by dollar volume, with ADR% and average dollar volume on every name. That is where most flags worth trading form.
- Every trade on its daily chart. Each breakout you take is charted with your entry and exit, so you can see whether you bought the flag or chased it.
- Setup tags and Trade Simulation. Tag your flag breakouts, then use the By Tag preset to compare your results with and without them, against what you actually did.
- Model Books. Save the RKLB-style flags into a book and build your own library of examples.
Sources and credits. The three-step breakout framework, flags and high tight flags as its variants, the opening-range-high entry, the low-of-day stop capped at one ADR and the partial-then-trail exit are Kristjan Kullamägi's (Qullamaggie), from My 3 timeless setups. Waiting for the 20-day to catch up, the 45-degree slope, volume confirmation, longer formations, later-stage flags, the sector effect and the wide-range starter are from fan-compiled notes of his streams, which are second-hand. The retracement of about a third and his liking for shakeouts are from his Chat With Traders interview. Some ideas are adapted from public trader interviews and notes. The high tight flag was popularised by William O'Neil in How to Make Money in Stocks; the name "power play" is usually credited to Mark Minervini. The momentum-burst criteria are Pradeep Bonde's. The worked trades (ANET, TSLA, AFRM, RKLB, GRAL and NTRA) are TradePiko's own, run on daily bars under the scan rules above and are illustrative, not a guarantee of future results; the universe is today's leaders, which flatters the results. Educational content only.