THE VOLATILITY CONTRACTION PATTERN.
A volatility contraction pattern (VCP) is a base in which each pullback is smaller than the one before.
A leading stock drops 20%, recovers, drops 10%, recovers, drops 5%, and then goes quiet near its highs. Then it breaks out. Mark Minervini popularised the pattern, and in one form or another it sits inside almost every breakout method this blog covers.
The idea is that the shrinking swings show sellers running out. Each dip attracts buyers sooner, volume fades, and by the right-hand side of the base there's so little supply left that a modest wave of demand can move the price a long way.
It also hands you something practical. The tight area at the end of the base is only a short distance from the breakout, so the stop is close and the position can be meaningful.
The anatomy of a VCP
Minervini describes the VCP as a teaching tool for something that happens anyway, the visible effect of supply and demand rather than its cause. In notes of a 2021 interview with him, the picture is price swings that get smaller from left to right, very tight on the right side, with volume drying up as the sellers get used up. It has four parts:
- An uptrend first. The VCP is a continuation pattern in a stock that's already leading. Minervini screens with his trend template before he looks at any base, and treats it as non-negotiable. A neat contraction in a stock in a downtrend isn't this setup.
- Successive contractions. Each pullback, measured from its high to its low, is shallower than the last. Traders often label them by depth, something like 25%, then 12%, then 6%.
- Volume drying up. Volume should fade as the pullbacks shrink, and be quietest in the final, tightest contraction. Fewer shares changing hands at lower prices means fewer holders willing to sell there.
- The pivot. This is the short, tight area at the end of the base, near the highs, and its top is the buy point. In Minervini's VCP, the tightness of the pivot is what makes the risk easy to define.
Why contraction works
After a big advance, plenty of holders want out: early buyers taking profits, and people who bought the top and just want their money back. That selling is what creates the first, deep pullback.
Each time the stock rallies, some of those sellers get their exit, and the supply overhead shrinks. So the next pullback is shallower, because there's less stock for sale, and buyers who missed the first move step in sooner.
By the final contraction, the stock barely moves and volume is light. That quiet is information. The shares that wanted to be sold have mostly been sold, and they're now in the hands of holders who didn't sell into two or three dips. When demand comes back, it meets very little supply, which is why a VCP breakout can travel fast.
The mechanical benefit matters just as much. Buying at the pivot puts your entry a few percent above the low of the last contraction or the breakout day. A tight stop means more shares for the same dollar risk, which is the tight-stop arithmetic applied to a pattern that hands you the level.
VCPs, tight flags and the stair-step
You won't find the letters VCP in Qullamaggie's breakout rules, but you'll find the idea everywhere.
His template is a big prior move, then an orderly pullback or consolidation of two weeks to two months with higher lows and a narrowing range, riding the rising 10- and 20-day averages, and then a range-expansion breakout. Leaders climb like a staircase, and your job is to find the tight step before the next leg, because tightness is what lets you use a tight stop. In his own summary of what matters, the key things are momentum, tightness and relative strength.
The differences are mostly emphasis. Qullamaggie cares more about the moving averages and higher lows, while the VCP framework cares more about the sequence of pullback depths and volume. And a high tight flag after a fast run is often a VCP compressed into two or three weeks.
Other traders build contraction into their rules in their own way:
- A stricter rule treats some contraction, in price or in price and volume, as mandatory, and skips any stock with loose prior action. Volume drying up is a plus, not a requirement, and candidates are ranked by relative strength first and the setup second.
- Against the stock's own ADR: contraction can be measured relative to its normal daily range, for example a stock that normally ranges 16% a day compressing to about 9% over three days, and describes the pivot as three to five tight, narrow-range days.
- Pradeep Bonde (Stockbee) wants an orderly, low-volume consolidation with contracting volatility and a narrow-range or down day just before the breakout, in his momentum-burst setup.
- An intraday version runs on the 5-minute chart: a burst, a low-volume fade, a failed push by sellers, and support at the 21-period EMA.
The databases behind the pattern
The traders who use the VCP mostly learned it by studying past examples, and several of those collections are public.
One community-compiled database went through more than 10,000 of Minervini's tweets and logged 908 long trade ideas, each with a chart showing the 20-, 50- and 200-day averages and the marked pivot. Its compiler believes the buy points are right on more than 90% of them, though not every idea was a trade Minervini actually took.
A separate database of 128 big winners tags each one by setup type: base breakout, IPO or flag. And another community-compiled database logs 160 breakouts with the factors before each one (including ADR, the prior gain and the number of tight days before the break) and what happened after.
None of them records contraction depths as data, so they can't tell you how deep a typical VCP is. They're best used the way their authors intended, as a library of charts to train your eye.
A definition you can compute
"Each pullback smaller than the last" sounds precise until you try to scan for it. Which wiggles count as pullbacks? Where does the base start? Here's a version you can scan for, which runs on any daily data:
Starts at the highest high of the prior 65 sessions, at least 15 sessions before today
A pullback
A fall from a swing high to a swing low of at least one ADR (the stock's 50-day average daily range). Smaller wiggles are ignored
A VCP
2 or more pullbacks, each shallower than the one before, and average volume in the last third of the base below the first third
The pivot and the trigger
The base high. The trade starts on the first day that trades above it
Measuring pullbacks in ADR units matters. A 4% dip in a stock that moves 6% a day is noise, but in a utility it's an event.
Two simpler measures are worth knowing too: the average daily range over the last five days of the base compared with the first ten, and the number of narrow-range days before the break.
No definition matches a trader's eye exactly. A base that looks like a textbook VCP on the chart can fail a strict rule because one pullback ran a little deeper than the one before it, and our definition rejects plenty of bases an experienced eye would happily buy. Both readings are defensible. The point of a strict definition is that you can scan for it and check it against your own trades.
Entry, stop and selling
The VCP tells you where. On its own, it doesn't tell you how to execute.
Most of the traders above use one of two triggers: a buy-stop just above the pivot, or Qullamaggie's opening-range high on the breakout morning, ideally on a wide-range day with clearly higher volume than usual.
For the stop, the rule this blog uses for breakouts is the low of the breakout day, never wider than one ADR (and in the examples below, never closer than a third of one). The low of the final contraction is the wider, more forgiving alternative, and a well-formed VCP keeps even that close.
Selling is the usual breakout plan: a third to a half after three to five days, then trail the rest with the 10- or 20-day average (see selling techniques). Minervini's own tactics vary with the market. In 2021, per the same interview notes, he used large size and tight stops, and sold within three days if a breakout didn't follow through.
VCP mistakes to avoid
- Finding VCPs in downtrends. Contraction in a falling stock is just a pause. Leadership comes first.
- Counting noise. Three 2% wiggles in a volatile stock aren't three contractions. Measure pullbacks against the ADR.
- Buying the pattern before the pivot breaks. A VCP is a setup. Without the breakout, it isn't a trade yet.
- Ignoring lower lows. A contraction whose low undercuts the previous one is shallower in percent, but supply is still winning at those prices. Many traders want higher lows as well.
- Expecting it to fix a bad market. A perfect base still fails when breakouts are failing everywhere.
A real VCP: NET, spring 2021
Cloudflare (NET) in spring 2021 gave a clean four-contraction base. Each pullback was shallower than the one before, from 23% down to 8%, and volume in the last third of the base was about half what it was in the first third.

NET broke through the pivot in June. The day's low was very close to the entry, so the stop went at the floor of a third of an ADR, 1.5% away. A third sold on day 5 and the rest on the first close below the 10-day in July, which came to +10.4R.
The tight pivot did the heavy lifting. A stop at the low of the last contraction would have been 23% away, and the same trade would have earned a fraction of that in R.
Two contractions and a volume surge: COIN, June 2025
Coinbase (COIN) in June 2025 shows a shorter version: two pullbacks, 13% and then 11%, with only a mild dry-up in volume.

It ran through the pivot on 3.4 times its average volume. The day's low was a long way below the entry, so the stop went one ADR below it instead. A third sold on day 5 and the rest on the first close below the 10-day, which came to +9.6R.
It also shows the limits of a definition. The second pullback was shallower in percent, so the base passes, but its low undercut the first one. If you insist on higher lows, as Qullamaggie's template does, you'd have marked this base down.
A tight pivot and a 1% stop: CCJ, August 2023
Cameco (CCJ) in August 2023 shows how tight the right side of a base can get. One real pullback of about 10% was followed by two small dips of under 5%, and volume more than halved as the base tightened.

It broke out on 1.8 times its average volume, and the day's low sat less than 1% below the entry, so the stop went at the floor of a third of an ADR, 1.0% away. The usual plan (a third on day 5, the rest on the first close below the 10-day) came to +7.9R, from a stock that finished only 10% above the entry.
That's the tight-stop arithmetic at work. Even the low of the last contraction was close by VCP standards, but a stop there would have been several times wider, and the trade would have been worth far fewer R.
Two contractions on quiet volume: SHOP, June 2020
Shopify (SHOP) built a two-contraction base in the spring of 2020: a drop of almost 19%, a rally, then a pullback of about 10%. Volume in the last third of the base was 58% of the first third, a clear dry-up.

The June breakout was quiet, on less than its average volume, and the stop went just under the day's low, 1.7% away. A third sold on day 5, and the rest went in July on a sharp reversal day that closed below the 10-day average. That came to +7.7R, though the exit came well below that day's high.
Two things stand out. A stop at the last contraction low would have been almost 17% away, about ten times wider, which would have shrunk the position to a sliver for the same risk. And a volume surge isn't always there on the breakout day. COIN broke out on 3.4 times its average volume and SHOP on less than its average, and both worked.
A VCP in a slow stock: LLY, July 2021
Eli Lilly (LLY) in July 2021 shows why pullbacks are measured in ADRs. Its average daily range was just 2.2%, so its three contractions look tiny in percent (5.2%, 3.3% and 2.3%). But each one was still more than one ADR, so all three count, and volume roughly halved through the base.

It broke out on light volume, and the stop went at the day's low, 1.25% away. With the same selling plan, that came to +7.0R on a stock that finished about 12% above the entry, because the stop was so close.
Look closely at the last two lows, though. The final one dipped just under the one before, the same kind of small undercut COIN had, so a strict higher-lows rule would have marked this base down too, even though it worked.
Higher lows and halving volume: TSLA, June 2020
Tesla (TSLA) in the spring of 2020 passes even the stricter reading. Its three pullbacks shrank from 21.5% to 9.7% to 9.5%, each low sat above the one before, and volume in the last third of the base was half what it was in the first third.

It cleared the pivot in June on slightly less than its average volume, and the stop went at the day's low, 1.8% away. A third sold on day 5 and the rest on the first close below the 10-day later that month, which came to +5.6R on a stock that finished about 10% above the entry.
Building your own VCP filter
Whether contraction matters for you depends on your entries and your stocks:
- Tag the base. For each breakout you take, note whether the base contracted, and by how much in the final pullback. After 30 or 40 trades, compare the two groups' win rate and average R.
- Measure tightness in ADRs. Record the depth of the last contraction as a multiple of the stock's ADR, not in percent, so volatile and quiet names are comparable.
- Check the stop it gave you. If your VCP trades have tighter stops but no higher win rate, the edge is in sizing, which is the arithmetic the NET and CCJ examples show. See how to trade breakouts for the rest of the process.
And study examples. Every trader quoted in this post built their eye by going through hundreds or thousands of past bases, and a few good ones in a model book will teach you more than any definition.
Find the leaders, then study their bases
A VCP is only worth trading in a stock that is already leading. TradePiko helps with the finding and the studying:
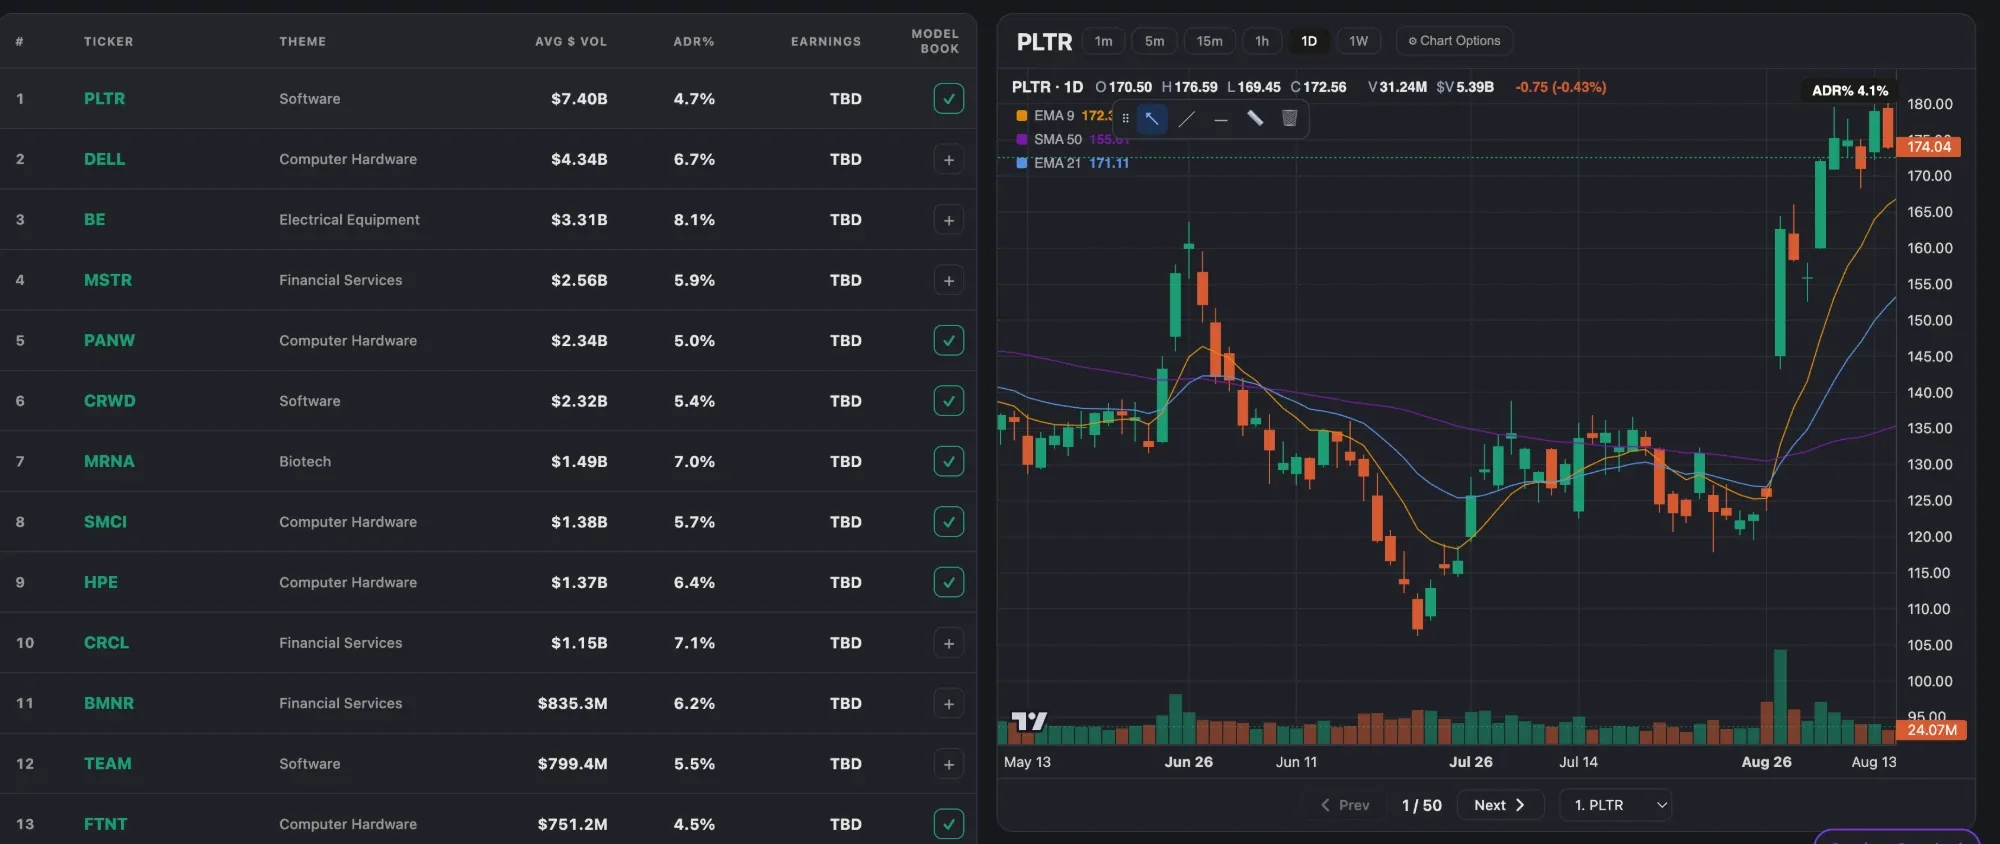
- The PIKO 50. A nightly list of the 50 highest-ranked momentum leaders, screened for the top 5% of stocks by relative strength, with ADR above 4%, at least $30M a day traded and price above the 65-day average, then ranked by dollar volume, with ADR% on every name so you can judge tightness in the stock's own units.
- Model Books. Save the NET-style VCPs into a book and build your own library of examples.
- Setup tags and Trade Simulation. Tag your VCP breakouts, then use the By Tag preset to compare your results with and without them, against what you actually did.
- Every trade on its daily chart, with MFE and MAE. See where you bought relative to the pivot, and how far each breakout went for you and against you.
Sources and credits. Some ideas are adapted from public trader interviews and notes. The volatility contraction pattern was popularised by Mark Minervini; his description of it as a teaching tool and the effect of supply and demand, the trend template as a first filter, and his 2021 tactics come from notes of a 2021 interview with him. The breakout template, stair-step and tightness ideas are Kristjan Kullamägi's (Qullamaggie), from My 3 timeless setups and community notes of his streams. The 2Lynch criteria are Pradeep Bonde's. Databases: the community-compiled Minervini's Historical Twitter Trade Ideas and big-winner database, and a community breakout database. The worked trades (NET, COIN, CCJ, SHOP, LLY and TSLA) are TradePiko's own, computed from daily bars, and are illustrative, not a guarantee of future results. Educational content only.