PULLBACK ENTRIES: BUYING THE 10 AND 20.
A stock that's really trending doesn't go up in a straight line. It runs, rests, and runs again, and the rest usually ends somewhere near its rising 10-day or 20-day moving average.
Buying that rest, rather than the breakout that came before it, is one of the oldest entries in swing trading. You join a trend that already exists, at a price close to a level that tells you quickly if you're wrong.
The catch is that the moving average itself isn't the edge. Plenty of stocks touch their 10-day on the way to breaking down. What matters is which pullbacks you buy: how strong the trend was, how deep and how quiet the dip was, and where you put the stop.
Why leaders pull back to the 10 and 20
Kristjan Kullamägi (Qullamaggie) describes the big winners as climbing a staircase. There's a leg higher, then a pause or pullback that tightens up, then the next leg.
On the best names, the 10- and 20-day averages slope up steeply underneath that staircase, and the pauses tend to end on or near them. In community notes of his streams, he calls the 10 and 20 so reliable as bounce levels that it's "almost like cheating". He also suggests checking which line a stock has respected so far, because it tends to keep respecting it.
There's nothing magic about the numbers 10 and 20. They work because they roughly track the average cost of recent buyers.
In a strong trend, the funds still building positions use dips toward that cost as a chance to add, and short-term holders who took profits want back in before the next leg. So demand shows up in a predictable place, and the dip stops there more often than chance would suggest.
Other traders frame it the same way: the 10 EMA for the first burst and the 21 EMA for longer trends, with the rule of thumb that a stock above a rising 10 EMA is doing nothing wrong.
Another handy habit is sorting your watchlists by the order of the 9, 21 and 50 EMAs, so the names stacked in the right order sit at the top, and then watching for their next pullback when several names from one sector show up together.
Whether you use simple averages or exponential ones matters less than using the same one every time. The 10-day vs 20-day post tests that directly.
What a healthy pullback looks like
A pullback is a pause in demand. A breakdown is the arrival of supply. On a daily chart they can look alike for a day or two, so the checklist below is about telling them apart before you buy.
- A real prior move. Qullamaggie's breakout template asks for a move of roughly 30–100% or more in the previous one to three months. A pullback only means something if there was a trend to pull back from.
- Rising averages, in the right order. The 10 above the 20, the 20 above the 50, and both short lines still pointing up. A pullback to a flat or falling line is just a stock going sideways.
- Orderly, lighter volume. The down days should come on less volume than the up days that built the move. Pradeep Bonde (Stockbee) looks for orderly, low-volume consolidation before his momentum bursts. A common refinement is to want price contracting above the 10 and 20, with volume drying up as a plus rather than a requirement.
- Shallow, measured in ADRs. Depth only makes sense relative to how much the stock normally moves. A 7% pullback is a shrug for a stock with a 7% average daily range, and a serious drop for one with a 2% ADR. Measuring from the recent high to the pullback low in ADR units makes every stock comparable.
- Early in the trend. The first pullback after a new leg starts is different from the fourth. Qullamaggie's notes say later-stage flags after a huge run are lower probability.
Three ways to trigger the entry
Touching the average is the setup. It isn't a trade until something shows you buyers have stepped back in.
The distinction is simple: a setup is a chart that looks right, and the trigger is what makes it a trade. Three triggers suit pullbacks.
The opening-range high
You buy when price clears the high of the first 1, 5, 30 or 60 minutes of the session, with the stop at the low of the day. This is Qullamaggie's entry for his breakouts and episodic pivots, and it works the same way on a stock turning up from its 10-day.
Some traders wait five minutes before using it. Waiting about 30 minutes, unless relative volume is extreme, is another common choice. The opening-range high post shows what changes as the range gets longer.
The prior day's high
Set an alert or a buy-stop just above the high of the pullback day, and take it if it trades. It's slower than an opening-range entry, but it needs no intraday chart and you can place it the night before.
A common opening plan treats the prior day's high as one of three scenarios: if the stock stays below it at the open, wait for it to break later. It's the trigger used in the worked trades below.
The reclaim
Here a stock undercuts the 10-day during the day, flushes out the stops sitting just below it, and closes back above the line. Qullamaggie's stream notes call an undercut of the 10-day that closes back above it very bullish.
You can buy near the close, with the stop at the day's low. It's the same idea as the undercut and rally, just applied to a moving average instead of a price level.
Where the stop goes
The natural stop is the pullback's own low, or the low of the entry day if you used an opening-range trigger. If the stock trades back below the low that marked the end of the rest, then the rest didn't end.
Before you buy, check that distance against the stock's ADR, because the stop decides the size. The further away it is, the fewer shares you can buy for the same risk.
The traders this blog draws on cap that distance in similar ways. Qullamaggie never lets the stop sit wider than the stock's ADR. Tighter traders keep it under half the ADR, or pass on a trade if the low of day is already more than 60% of the ATR away. Another common limit keeps the stop under one ADR and never more than 12%, whatever the ADR.
If the pullback low is too far away, skip the trade or wait for a tighter one. The full trade-off is in why a tighter stop can mean far more upside.
Some traders use a close below the moving average as the stop instead of a price. That gives the stock more room, but it's a wider, vaguer risk, and you only find out how much you lost at the close. A price level you can place as an order is easier to size, and easier to stick to.
When pullbacks fail
Most failed pullbacks give you a warning first. These are the common ones:
- The averages flatten and converge. When the 10 and 20 run sideways and sit on top of each other, price chops through both and every "touch" is just noise. In choppy markets, a flat 5-day average, or price repeatedly rejected at it, is a good reason to stand aside.
- The pullback starts with heavy volume. A gap down or a wide red day on two or three times normal volume after a vertical run is supply, not a rest. A sensible rule is to drop a name from the list after a fall of two ADRs on heavy volume.
- It's too deep. A pullback that gives back several ADRs has usually broken the structure that made the setup worth buying, and the stop you'd need to protect it is too wide to size well.
- The trend is old. The third and fourth pullbacks in a trend come after most of the move has happened, when more holders are sitting on profits they'd like to bank.
A failed pullback isn't always the end of the stock, though. Qullamaggie's notes allow buying back after a stop-out if price finds support on the 10 or 20 again and starts making higher lows. The stop just keeps you out of it while you find out.
Market context
Pullbacks are a trend-following entry, so they need a market that rewards trends.
Qullamaggie's traffic light is the index's own 10- and 20-day averages. When the 10 is above the 20 and both are rising, his setups work. A 10 below the 20 is the red light.
Breadth (the share of stocks above their 20-day) is a useful second read. In a falling market, a pullback tends to be the first step of the stock following the index down. The market environment post tests the traffic light on its own.
Rules you can scan for
If you want to find these setups with a scanner instead of by eye, the checklist above turns into a handful of rules. All six trades below follow them.
- Trend: 10-day SMA above the 20-day, 20-day above the 50-day, and the 20-day higher than five sessions earlier.
- Leader: the high of the last 15 sessions at least 30% above the lowest low of the last 63.
- Pullback: the first day the low reaches the 10-day (the day before stayed above it), at least two sessions after the recent high, with the close still above the 20-day. For a pullback to the 20-day, swap the line: the low reaches the 20-day and the close holds above it.
- Trigger: within three sessions, price trades above the prior day's high; buy there, or at the open if it gaps above. Cancel if it closes below the 20-day first.
- Stop: the pullback low. Skip the trade if that is more than one ADR below the entry.
- Exit: sell a third at the close of day 5 and move the stop to break-even; trail the rest to the first close below the 10-day. These are the same exits as our breakout test.
A pullback that worked: CCJ in May 2025
Cameco (CCJ) is the textbook case. It ran 53% off its April 2025 low, with the 10-day crossing above the 20-day and both rising steeply. That's the kind of trend you want before you even look at a pullback.
Then it rested for three sessions. Volume dried up as it went, and the low touched the rising 10-day for the first time since the trend began.

The next morning CCJ opened above the prior day's high, so the trigger filled at the open, and the stop went under the pullback low.
After the first day it never traded below the entry again, and the rest rode the trend until the first close below the 10-day in July, for +9.7R. That's the exception, not the rule, so read it as a clean example of the setup rather than a typical result.
A first touch that worked: HOOD in May 2025
Robinhood (HOOD) came out of the April 2025 low even faster, up 73% in 17 sessions. The rest that followed was short and not perfectly clean, since it started with a wide red day on heavy volume. But the next sessions were quieter, and the low touched the rising 10-day on light volume, the first touch in the new trend.
The dip was 11% off the high, which sounds deep. HOOD moved almost 10% a day, though, so in ADRs it was only 1.2.

The next day it opened below the prior day's high and then traded through it for the entry, with the stop under the pullback low. Because the trigger waited for the stock to turn up, the entry sat only 0.6 ADR above the low, and that kept the position a normal size on a stock this volatile.
It barely dipped under the entry the next day and then never looked back. A third went on day 5 and the rest on the first close below the 10-day in June, for +7.5R.
A slow stock's third touch: NVDA in June 2025
Not every good pullback comes in a fast mover. Nvidia (NVDA) climbed 67% off the same April 2025 low, but it took 43 sessions, and by June it was only moving 2.6% a day. By then it had already touched the 10-day twice, so the June touch was the third.
The dip itself was tiny: a few quiet sessions of drift and a low just 2.9% under the high. In ADRs, though, that's 1.1, about the same as HOOD's 11% pullback.

It traded through the prior day's high for the entry, with a stop under 2% away. Same dollar risk as HOOD, but a position three times the size, which is what measuring in ADRs gives you: the two pullbacks looked alike on the chart, and the size adjusted itself.
It's also a third touch, where Qullamaggie's notes would expect lower odds. This one never came back to the stop and finished at +6.3R. One chart doesn't overturn the rule of thumb, but a quiet, shallow dip in a steady trend can still be worth taking.
A sideways rest: CCL in November 2023
Not every pullback is a drop. Carnival (CCL) ran 38% off its October 2023 low in 19 sessions, then went sideways for about a week instead of falling. It gave back less than one ADR, and the rising 10-day kept climbing until it caught up with the lows. Volume stayed below average the whole time, and the low met the line on one of the quietest days of the rest.

The next morning CCL opened above the prior day's high, so the trigger filled at the open, like CCJ, and the stop under the pullback low was just over half an ADR away.
After the first day it never traded below the entry again. The third that came off on day 5 was already up 8R, and the rest rode the trend until the first close below the 10-day in December, for +9.3R.
A pullback to the 20-day: RKLB in April 2026
Sometimes the 10-day doesn't hold and the 20-day does. Rocket Lab (RKLB) ran 66% in 16 sessions into April 2026, and the first dip went straight through the 10-day. Then volume faded, and the stock undercut the rising 20-day before closing back above it.
That pullback was 20.5% deep, or 2.9 ADRs, which is close to the "too deep" warning above. But the stop is measured from the entry, not from the high, so the risk could still be small.

The next day it traded through the prior day's high, and the stop under the low was 0.7 ADR away. For five sessions nothing happened, so the day-5 third went for roughly break-even and the stop moved up to the entry.
Then RKLB closed 34% higher in a single day on heavy volume, and the trend carried the rest to +7.4R. The pullback entry didn't predict that day. It just had you in, with a small, defined risk, when it came.
Another pullback to the 20-day: CRL in June 2026
Charles River Laboratories (CRL) shows the 20-day version in a slower stock. It ran 33% off its May 2026 low in 15 sessions, then rested for two weeks. The rest dipped under the 10-day twice and had a couple of heavier sessions in the middle, so it wasn't perfect. But the low that finally reached the rising 20-day came on below-average volume, and the stock closed back above the line.
The dip was 1.7 ADRs, a good deal shallower than RKLB's.

The next day it opened below the prior day's high and then traded through it for the entry, with the stop under the pullback low 0.9 ADR away. That's close to the one-ADR limit, so the position was on the small side.
The session after, it broke out of the rest and never came back to the entry. A third went on day 5 and the rest on the first close below the 10-day in July, for +5.6R.
Testing it on your own pullbacks
Six charts aren't a rule to copy. What they give you is a list of questions to ask of your own trades:
- Tag every pullback entry, and add the touch number: first, second, third. After 20–30 trades, compare them. If your later touches lose, stop taking them.
- Record the depth in ADRs and the stop in ADRs. You may find a depth where your pullbacks stop working, and a stop width where they start getting shaken out.
- Note the trigger you used: opening-range high, prior-day high or reclaim. The trigger changes the stop, the size and how often you get shaken out.
- Look at the prior move on your best and worst pullback trades. A pullback in a stock that hasn't really moved yet, or one that's already gone vertical, is a different trade from one in a strong, orderly leader.
Then compare the setup with your other entries on the same footing, in R, before you decide how much of your trading it deserves. How to review your trades walks through a weekly and monthly routine for exactly that.
See whether your pullbacks pay
The trades above are hand-picked examples. The question that matters is how your own pullback entries behave, and TradePiko answers it from your broker history:
- Setup tags, applied for you. Longs filled below the previous day's close are tagged Pullback automatically, and you can add your own tags, such as first touch or later touch, to compare win rate and expectancy by tag.
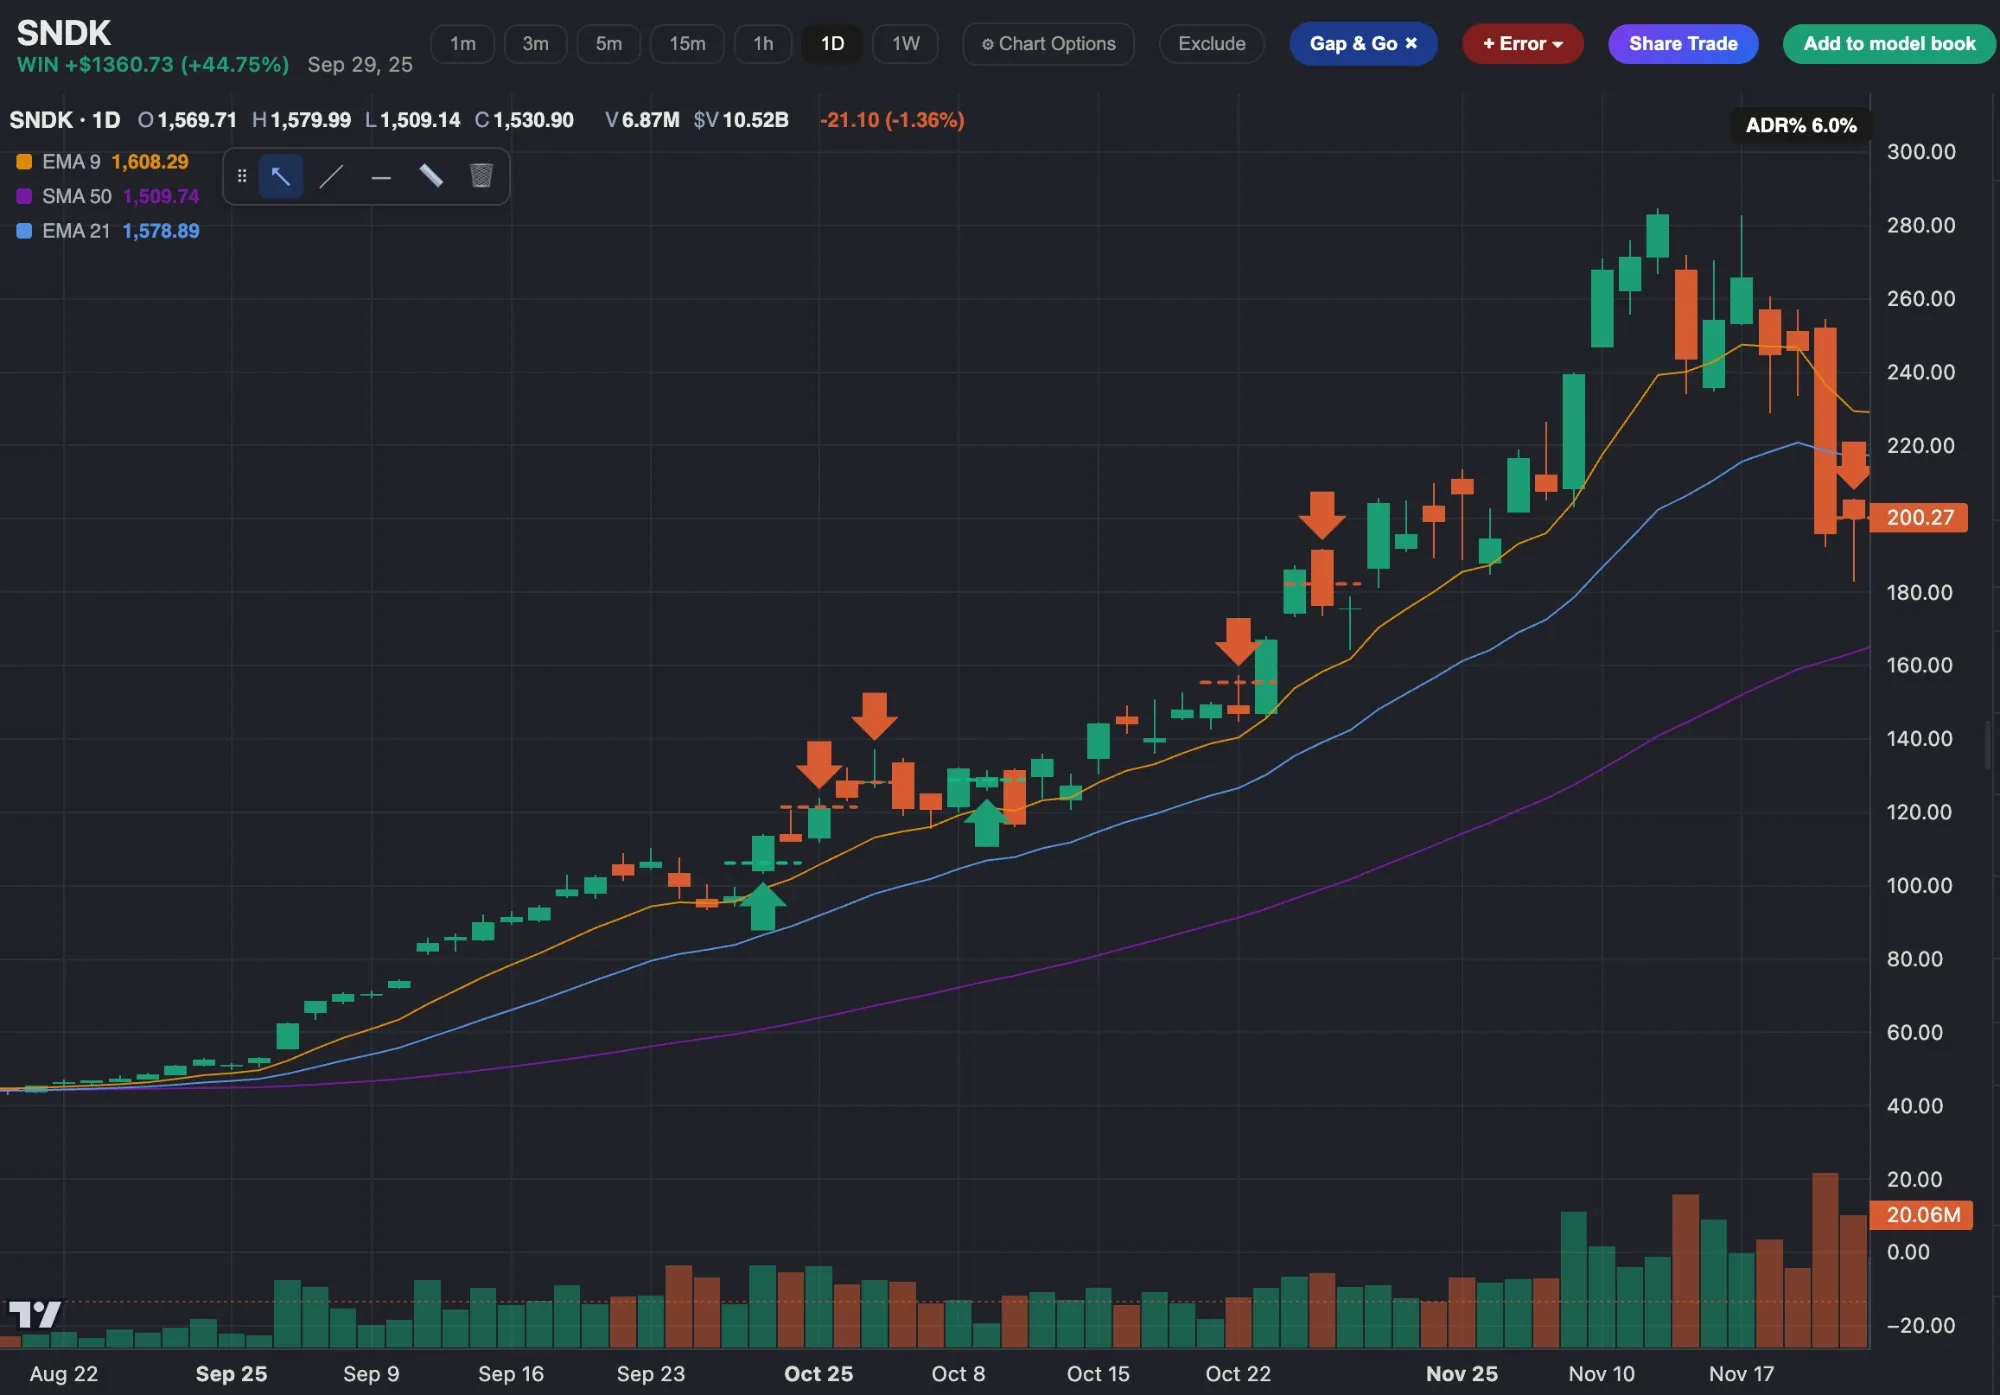
- Every trade on its daily chart. Each trade is plotted with its entry, exit and the 9- and 21-day EMAs, so you can see whether you bought into rising averages or flat ones, and how deep the pullback was.
- MFE and MAE per trade. See how far your pullback entries went against you before working, and whether your stop sat inside the stock's normal noise.
- The PIKO 50 with ADR%. The nightly momentum list shows each leader's ADR, so you can measure a pullback's depth and a stop's width in ADRs before the open.
Sources and credits. The staircase pattern, the prior-move and rising-10/20-day template, the opening-range-high entry with a low-of-day stop no wider than the ADR, and the index 10/20 traffic light are Kristjan Kullamägi's (Qullamaggie), from My 3 timeless setups and his Chat With Traders interview. The "almost like cheating" remark, checking which average a stock respects, the bullish 10-day undercut-and-close, re-entry after a stop-out and the lower odds of later-stage flags are from community notes of his streams, which are second-hand. Orderly low-volume consolidation is Pradeep Bonde's (Stockbee). Some ideas are adapted from public trader interviews and notes. The worked trades (CCJ, HOOD, NVDA, CCL, RKLB and CRL) are TradePiko's own, chosen with hindsight from daily price data, and are illustrative, not a guarantee of future results. Educational content only.